 Price Analysis
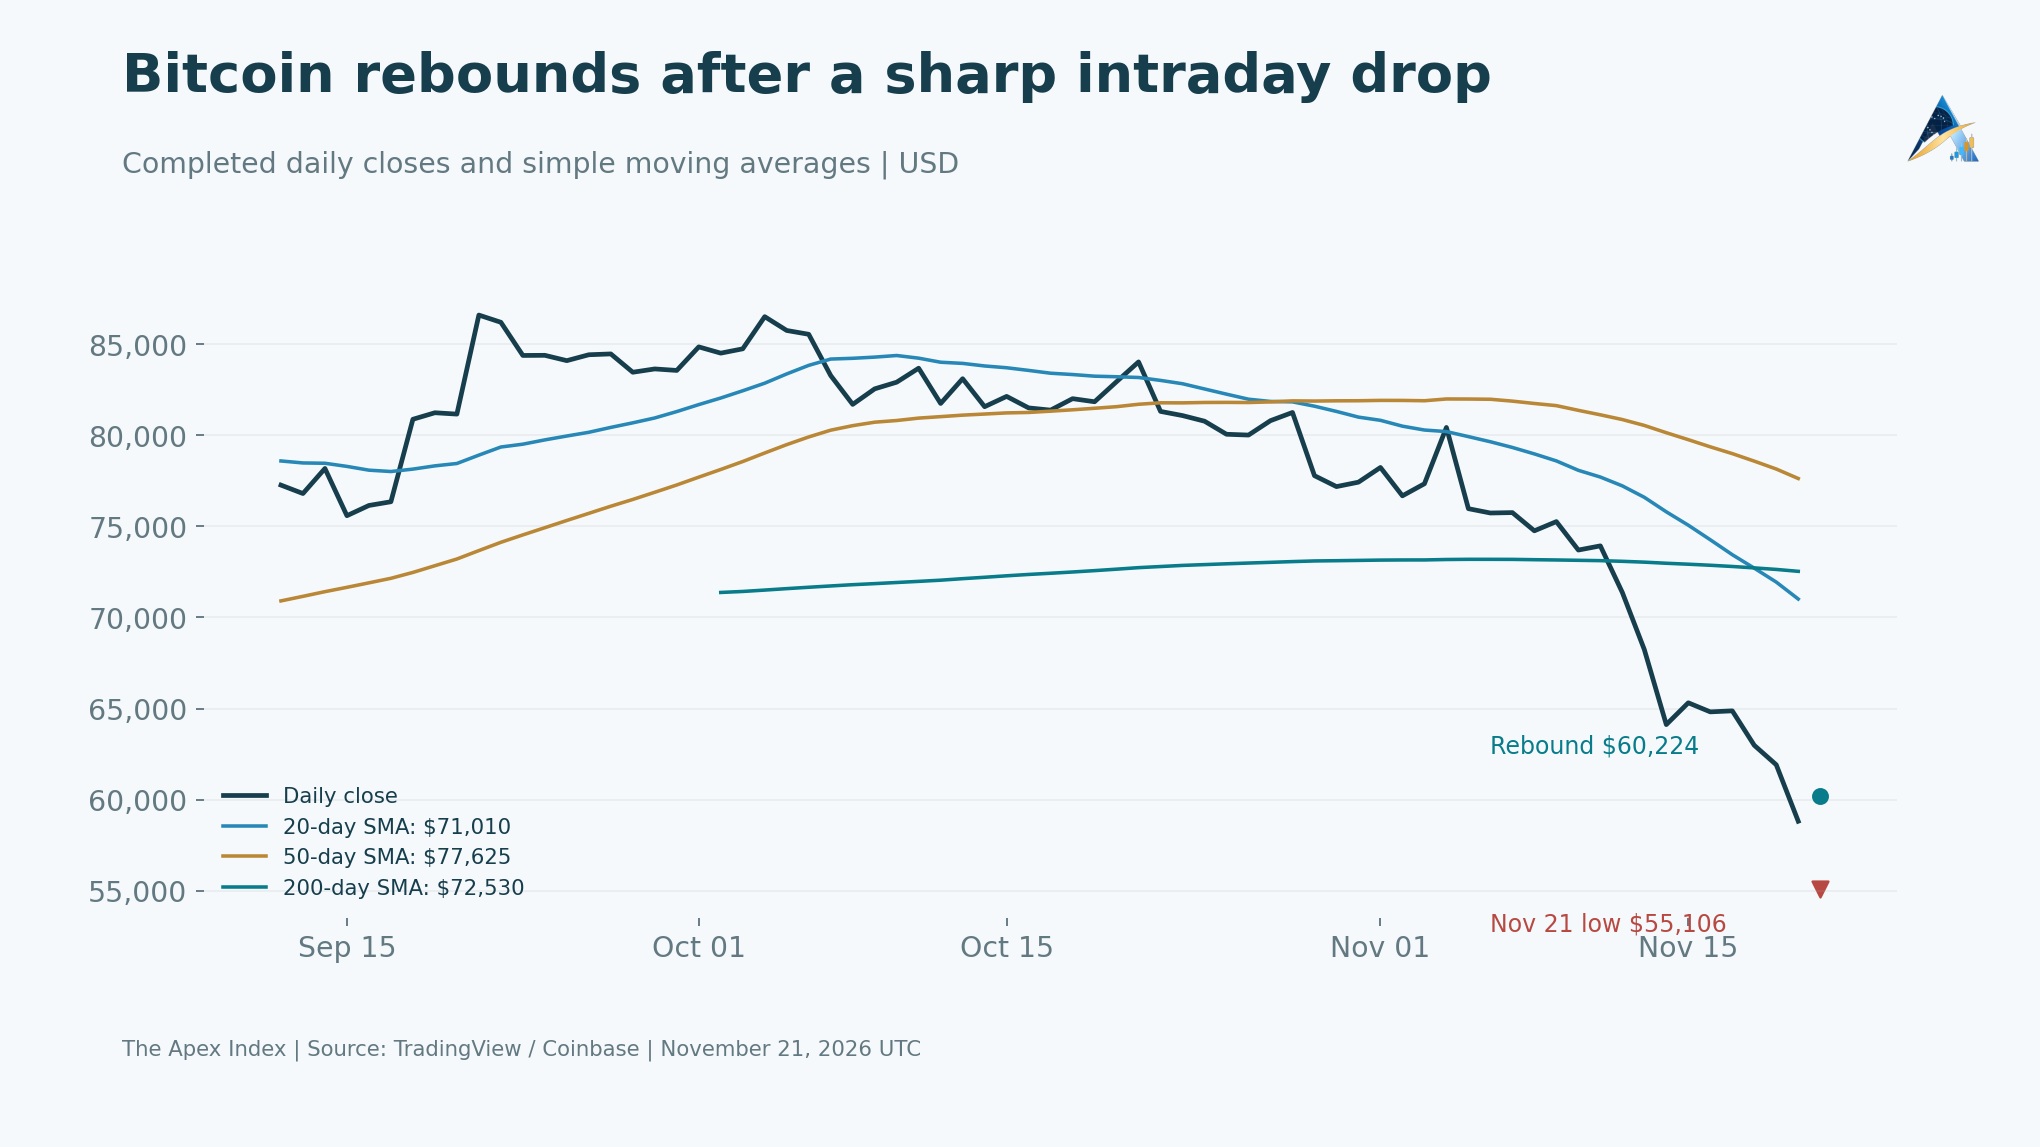
Bitcoin reclaims $60,000 after rebounding from $55,106 low
Bitcoin recovers about 9.3% from its Saturday low as hourly RSI moves above 50. Fresh charts map the $60,000 defense and $60,883 resistance.

Verified charts, conditional scenarios and the levels that matter.
Price AnalysisBitcoin recovers about 9.3% from its Saturday low as hourly RSI moves above 50. Fresh charts map the $60,000 defense and $60,883 resistance.
 Price Analysis
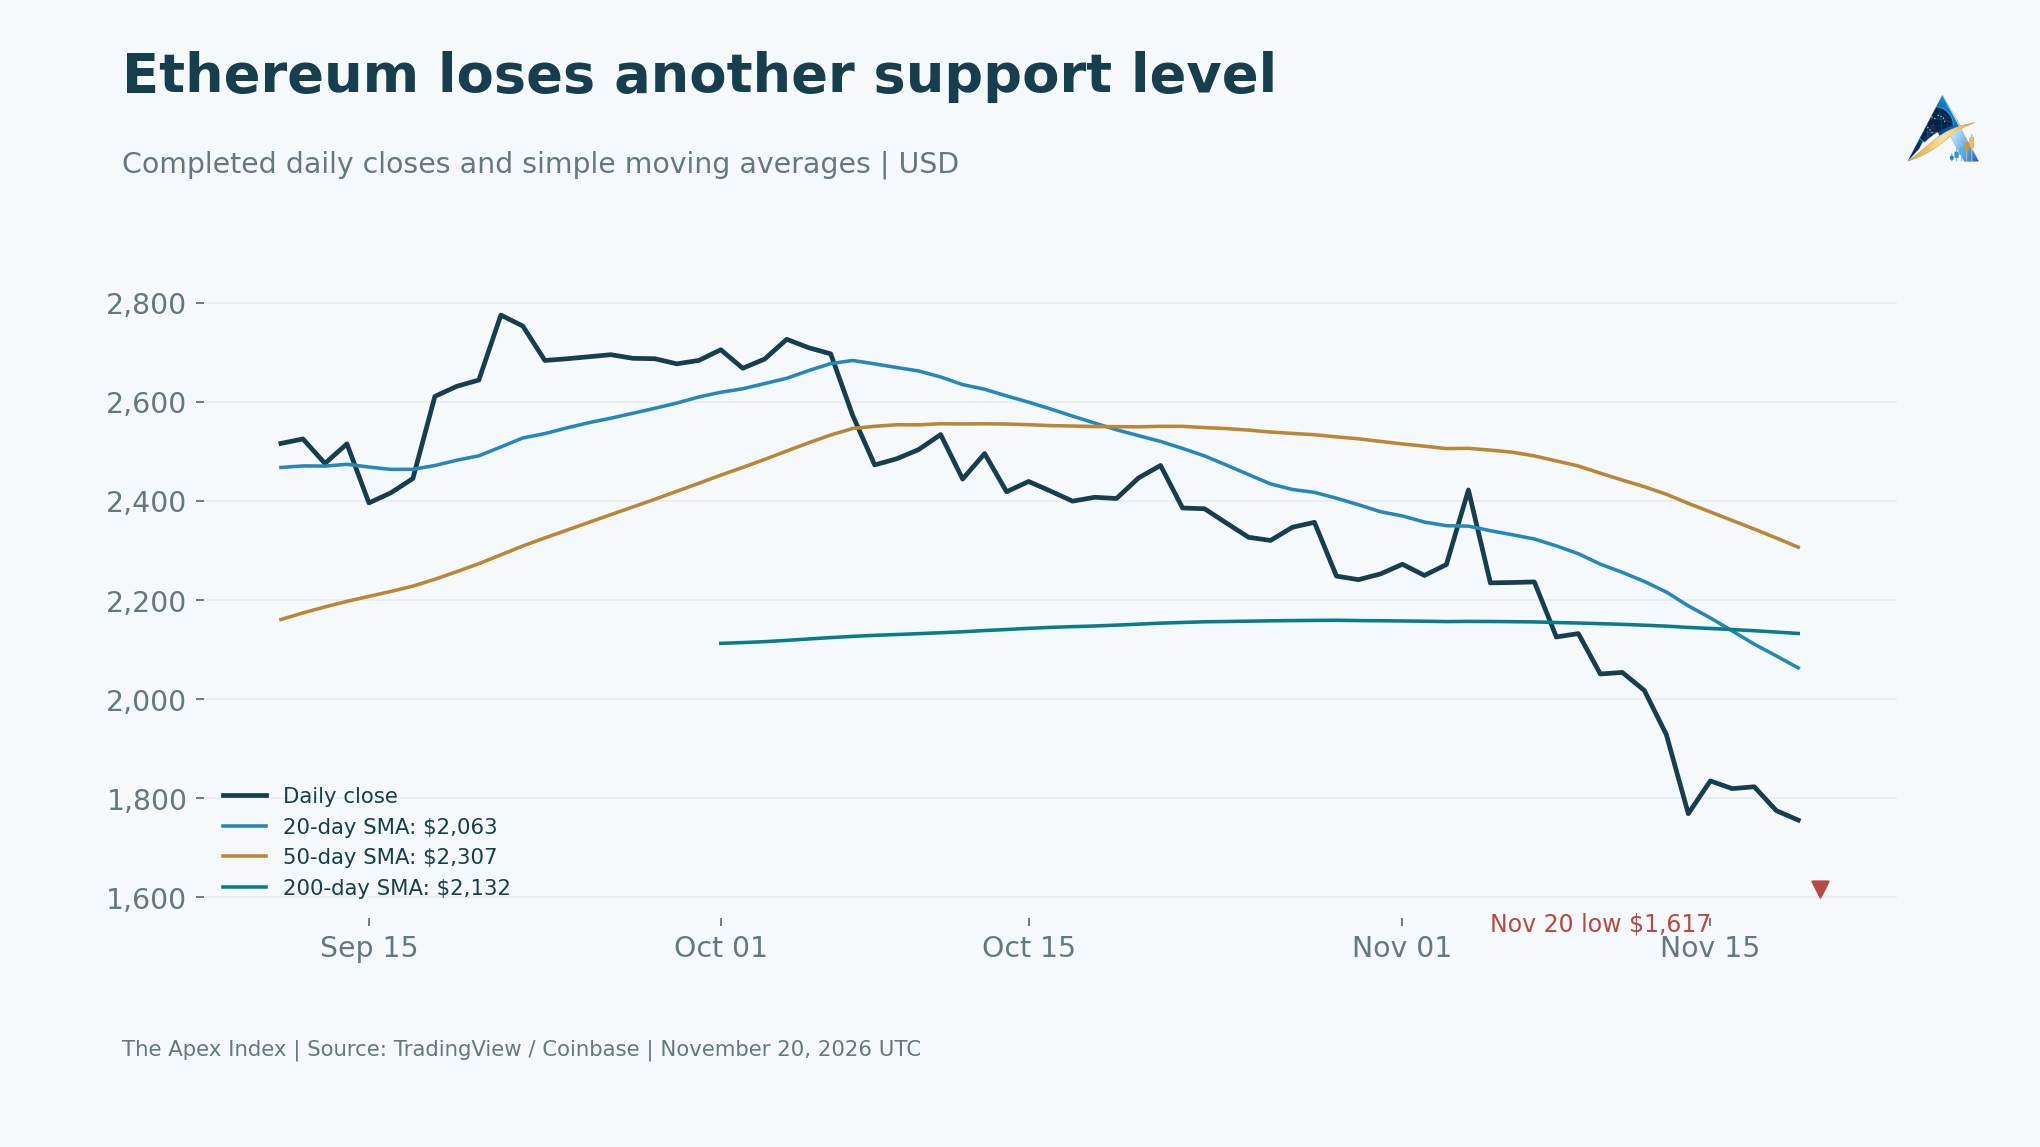
Ether falls near $1,627 as sellers break Thursday's range. Fresh charts map the $1,617 low, the $1,600 test and resistance at $1,650-$1,700.
 Price Analysis
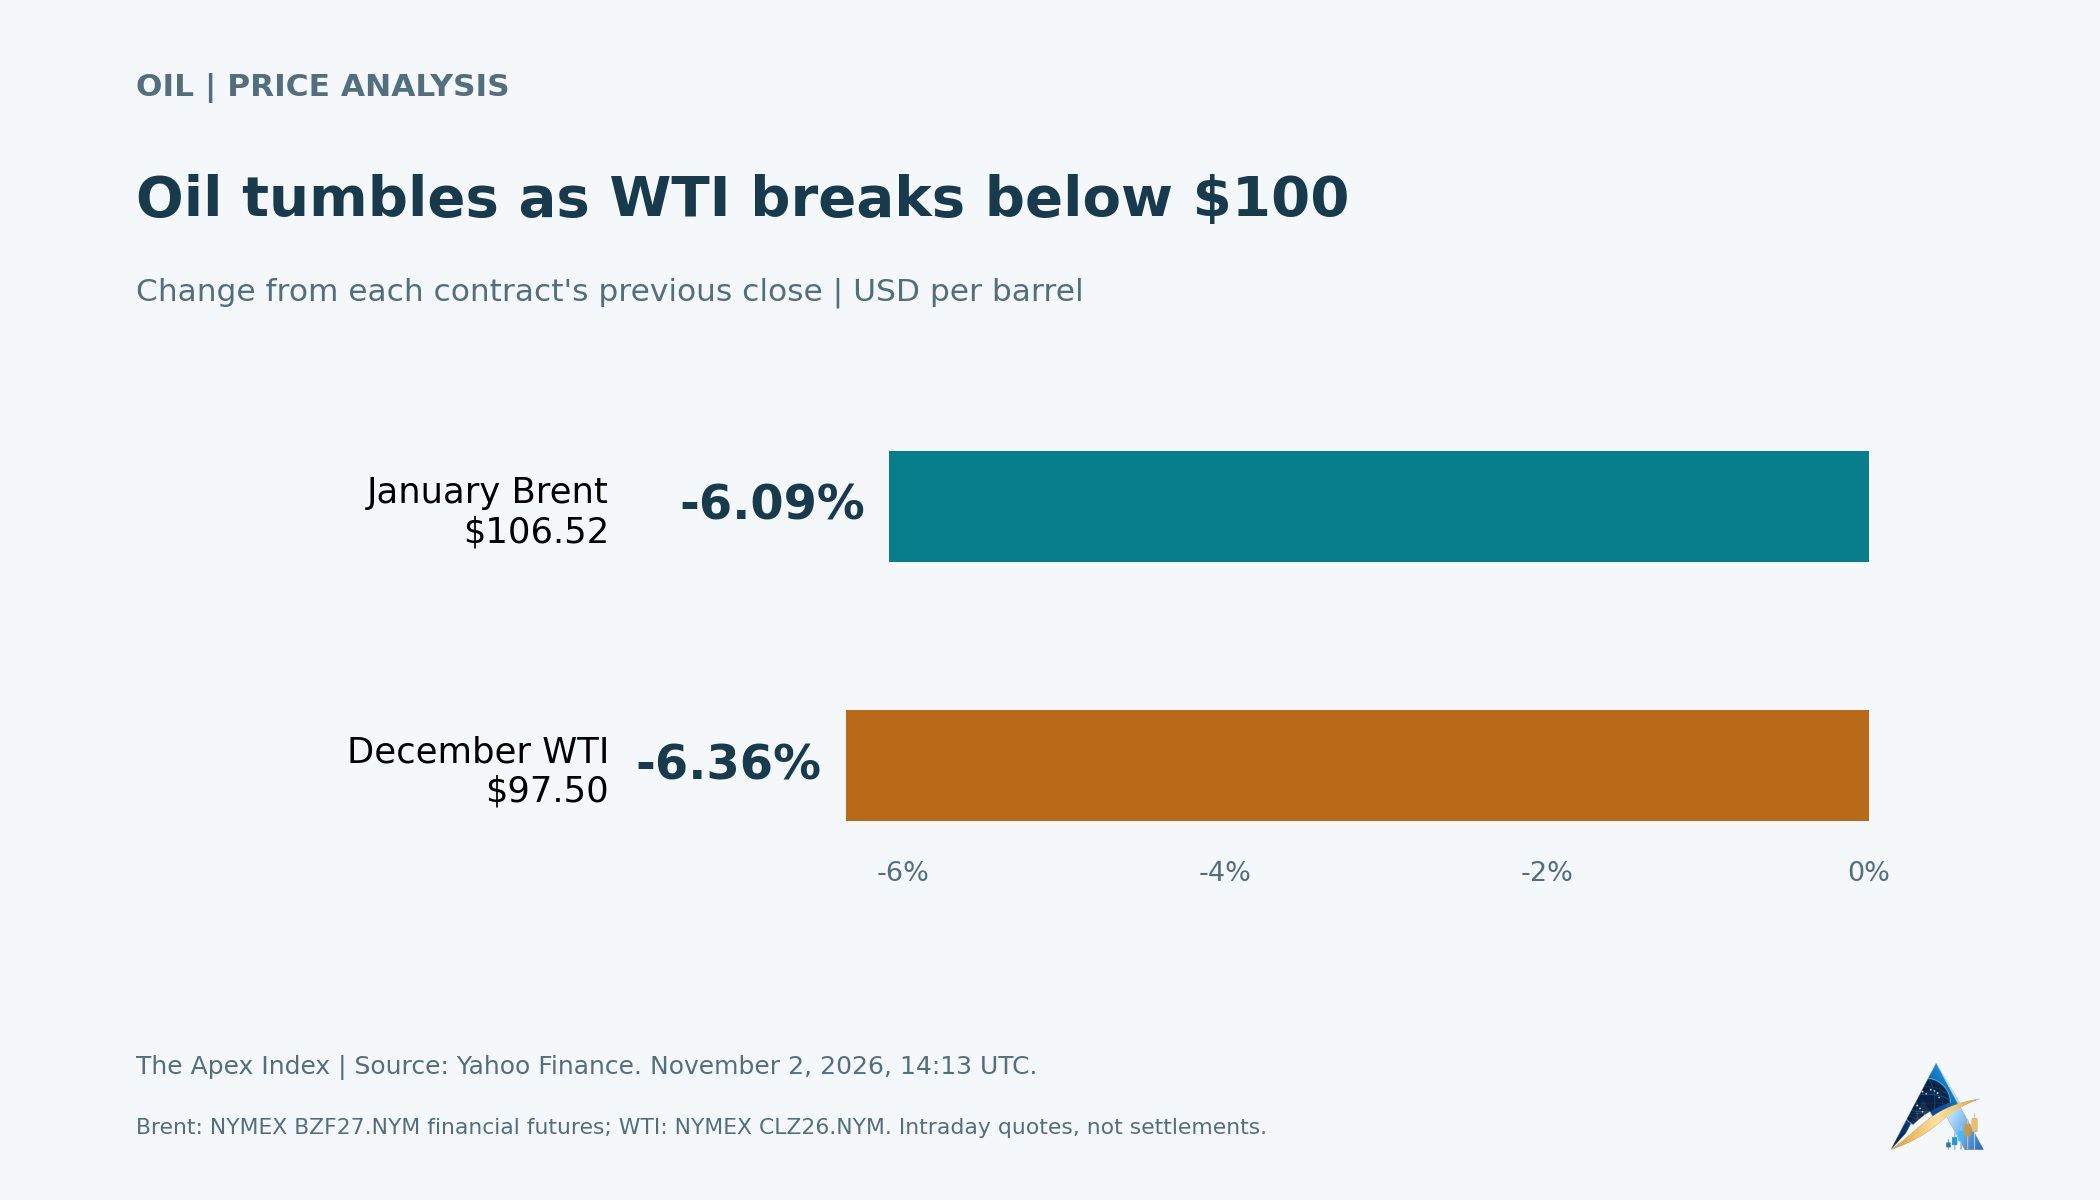
WTI falls below $100 as Iran says mediated talks continue. Brent and US crude approach their 20-day averages, with no peace agreement announced.
 Price Analysis
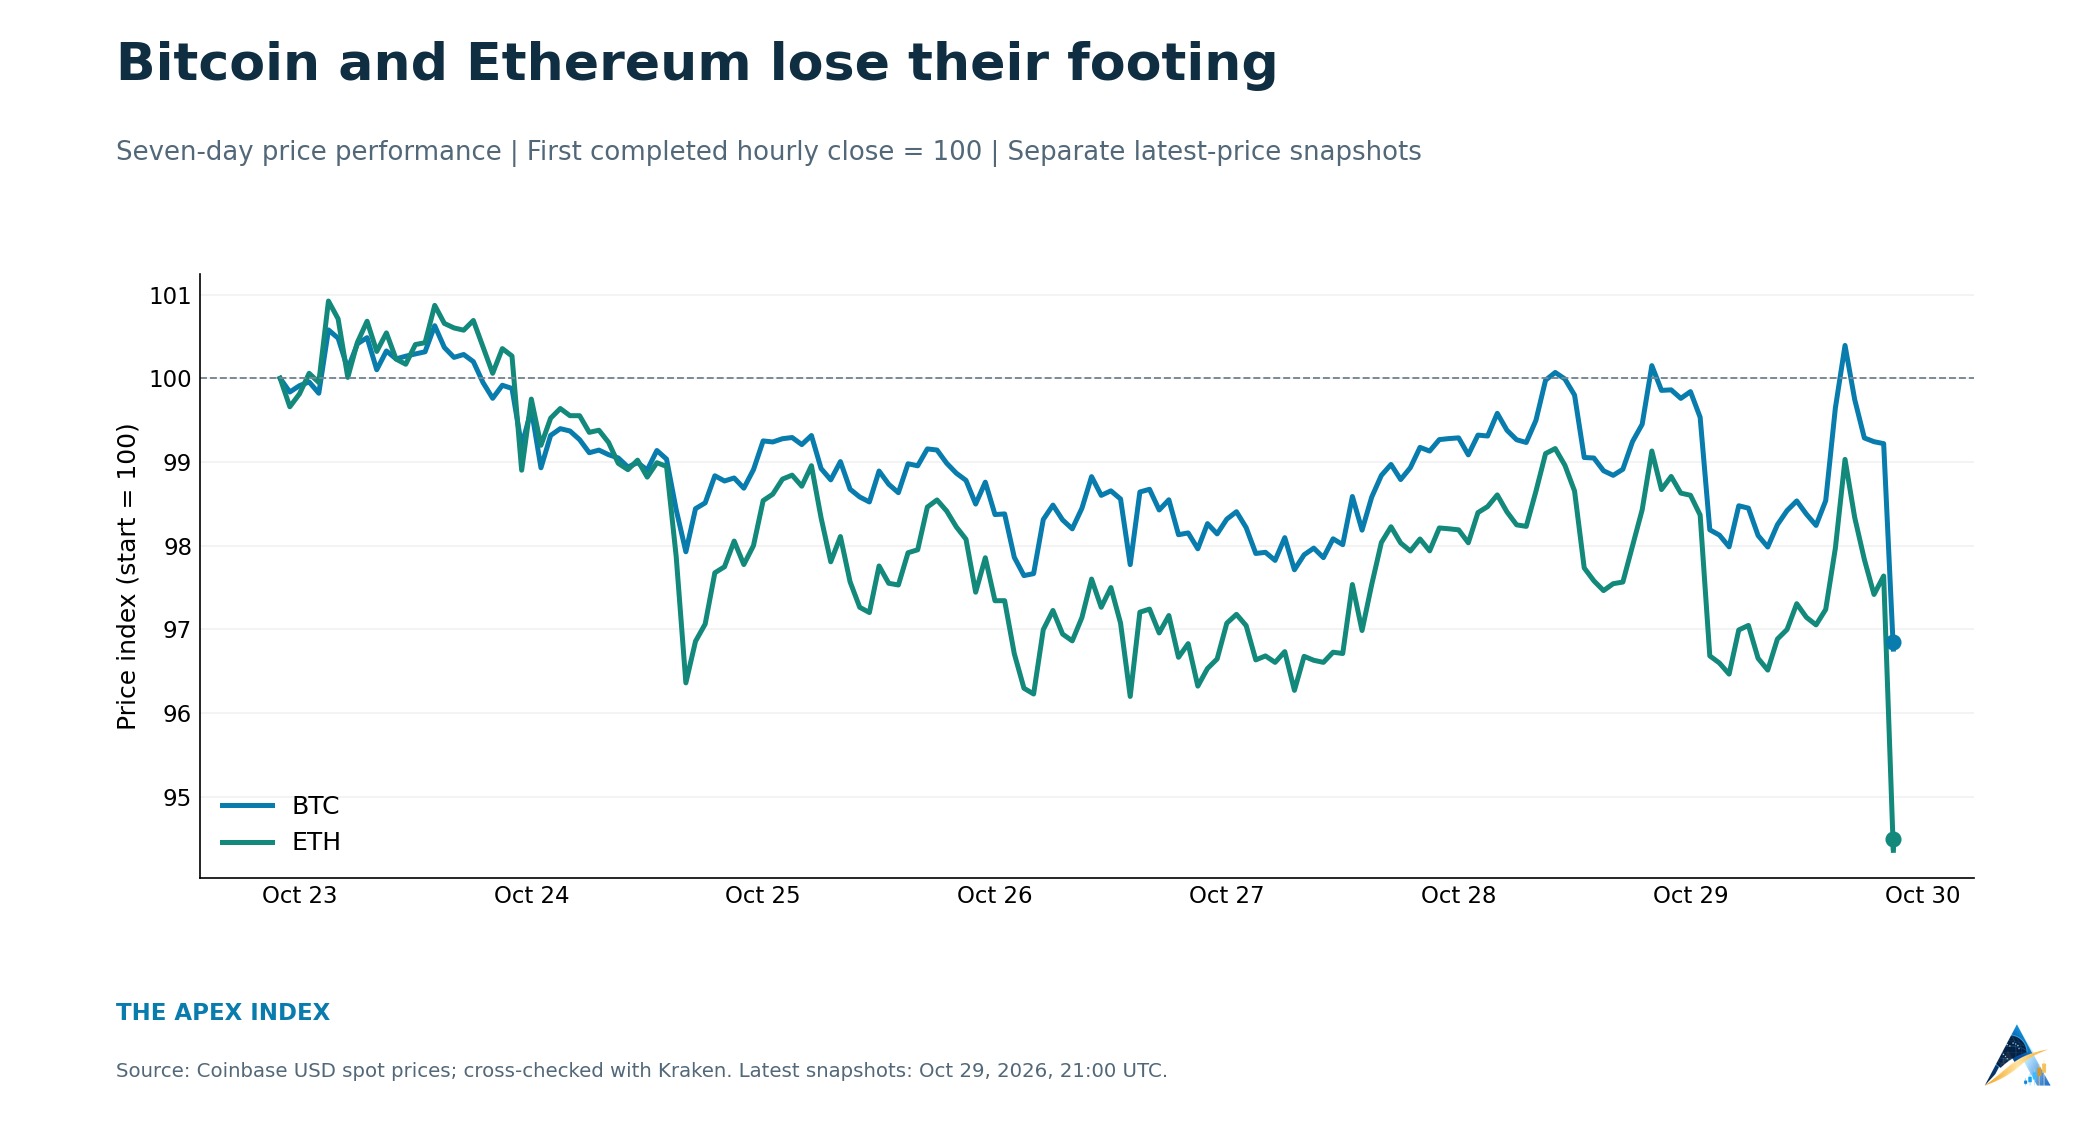
Bitcoin fell below $79,000 and ether below $2,300 as inflation, rate worries and a tech selloff hit risk appetite. Here are the levels that matter next.
 Price Analysis
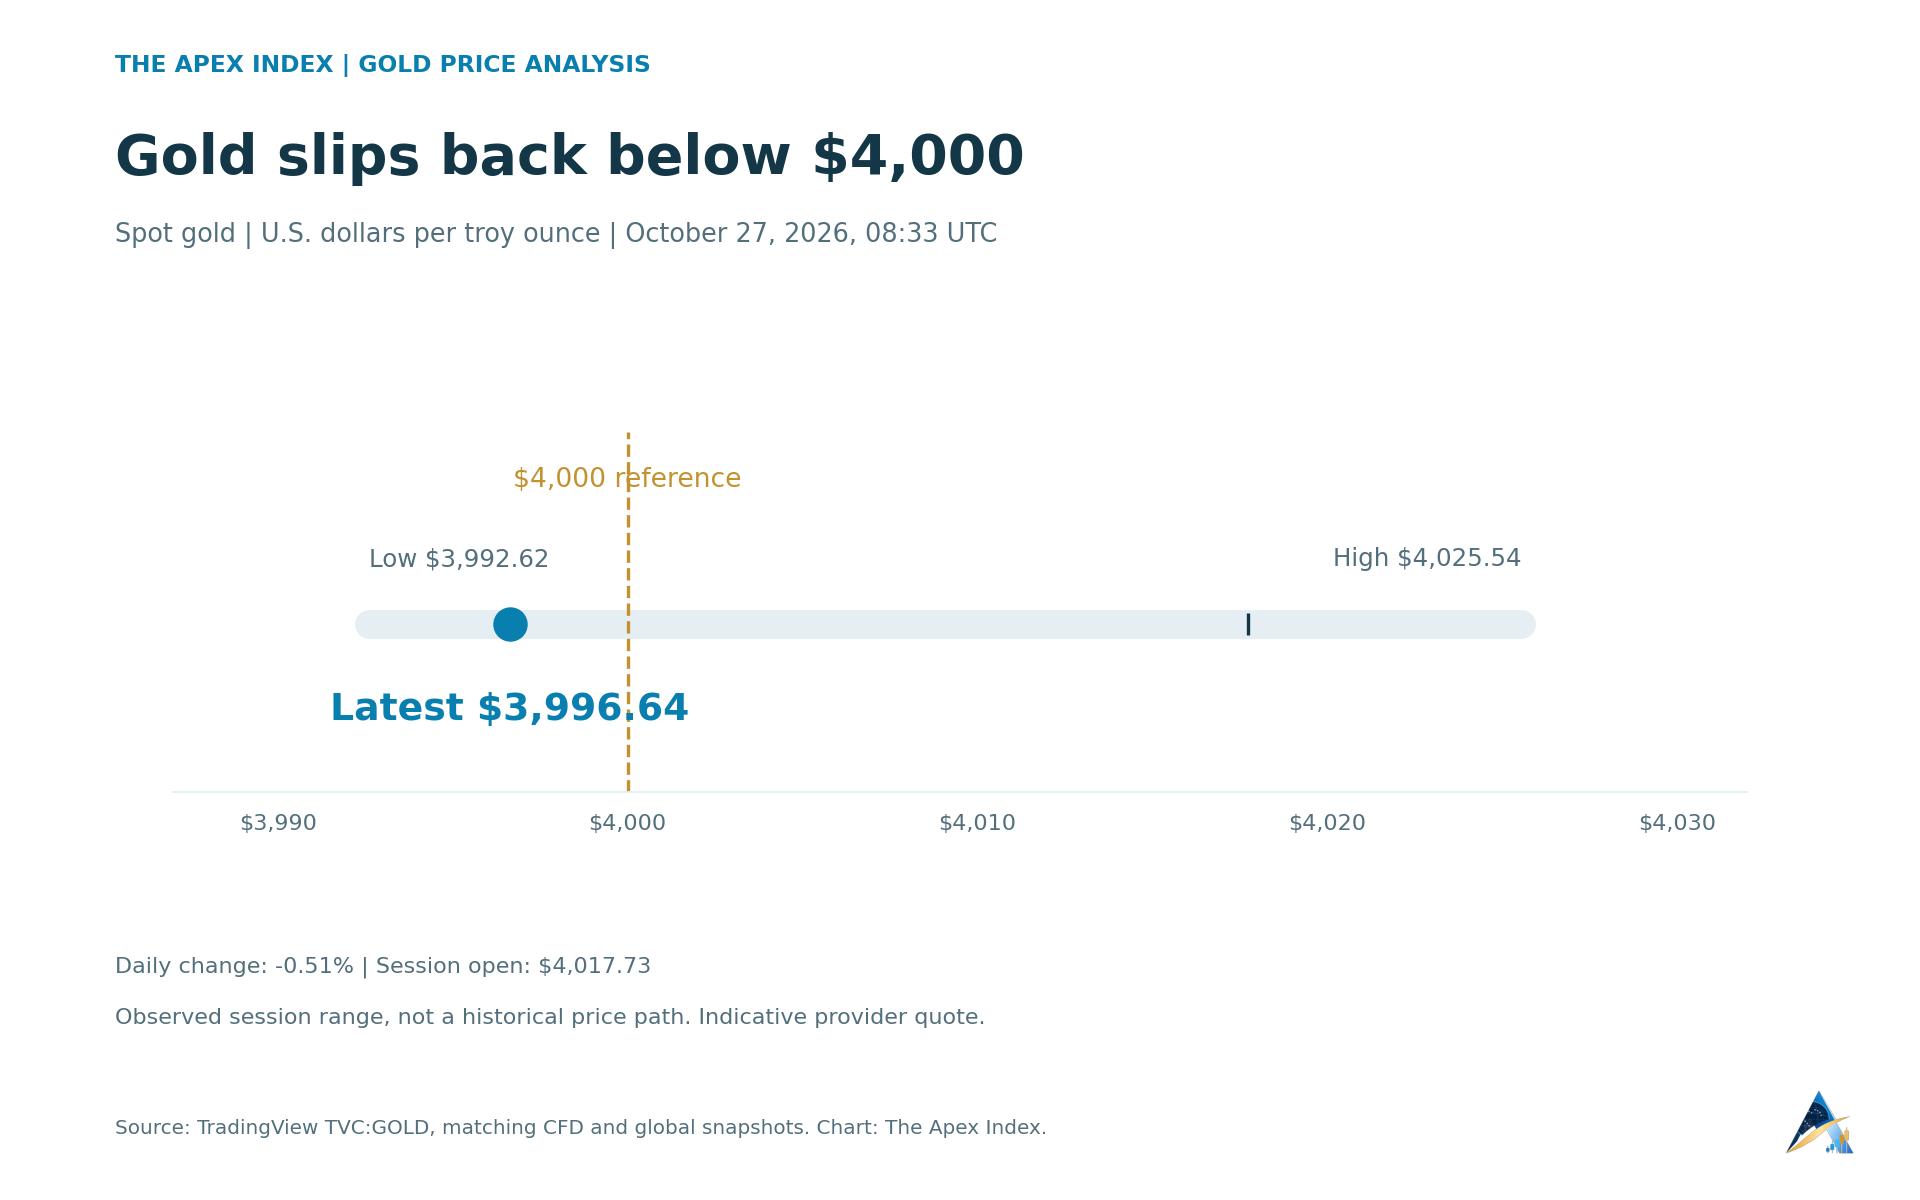
Chinese households are buying cheaper gold, but weak jewelry demand, interest rates and bearish technical signals complicate the rebound case.
 Price Analysis
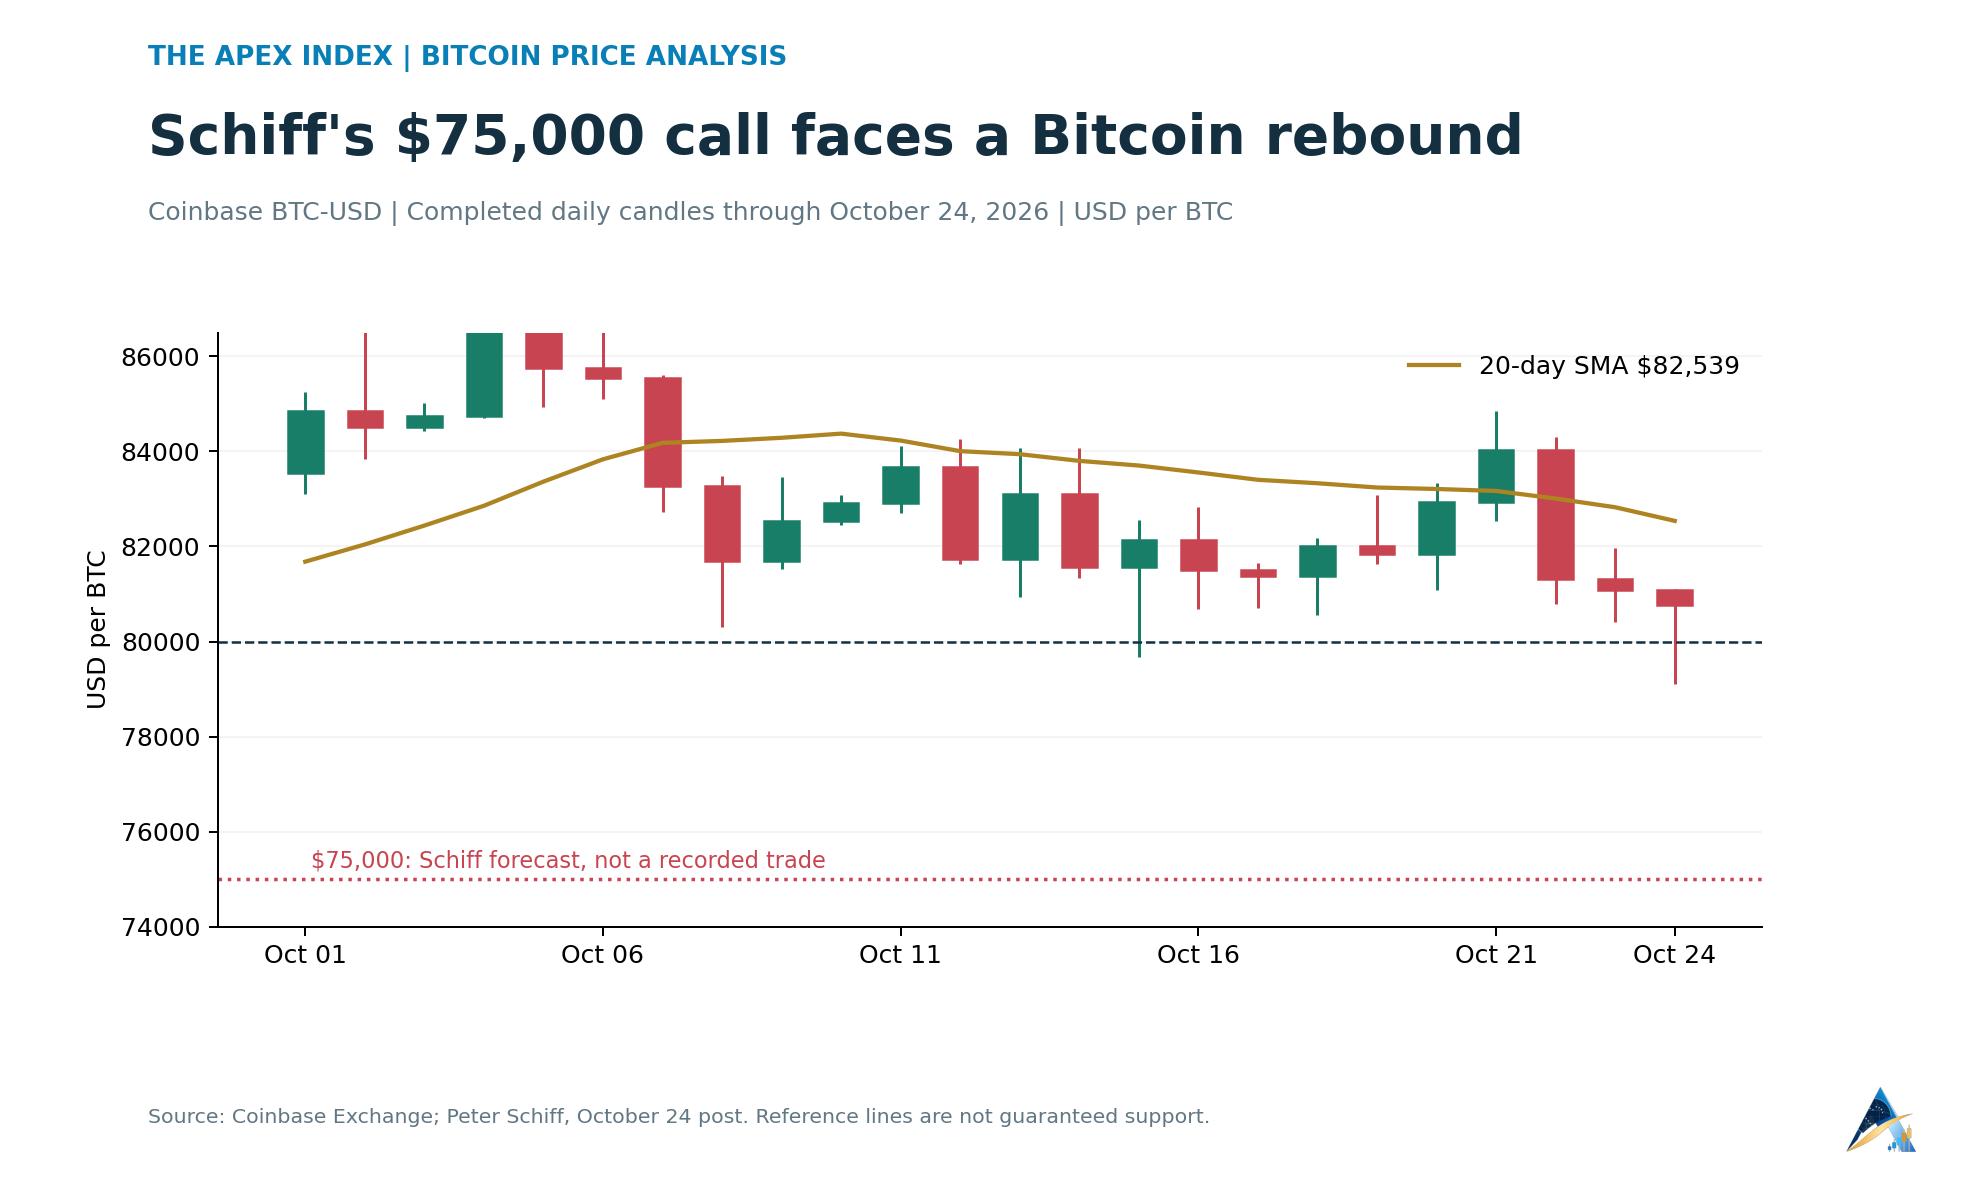
Schiff sees $75,000 after Saturday's drop, but Bitcoin has bounced back above $80,000. Charts show the support levels, moving averages and momentum.
 Price Analysis
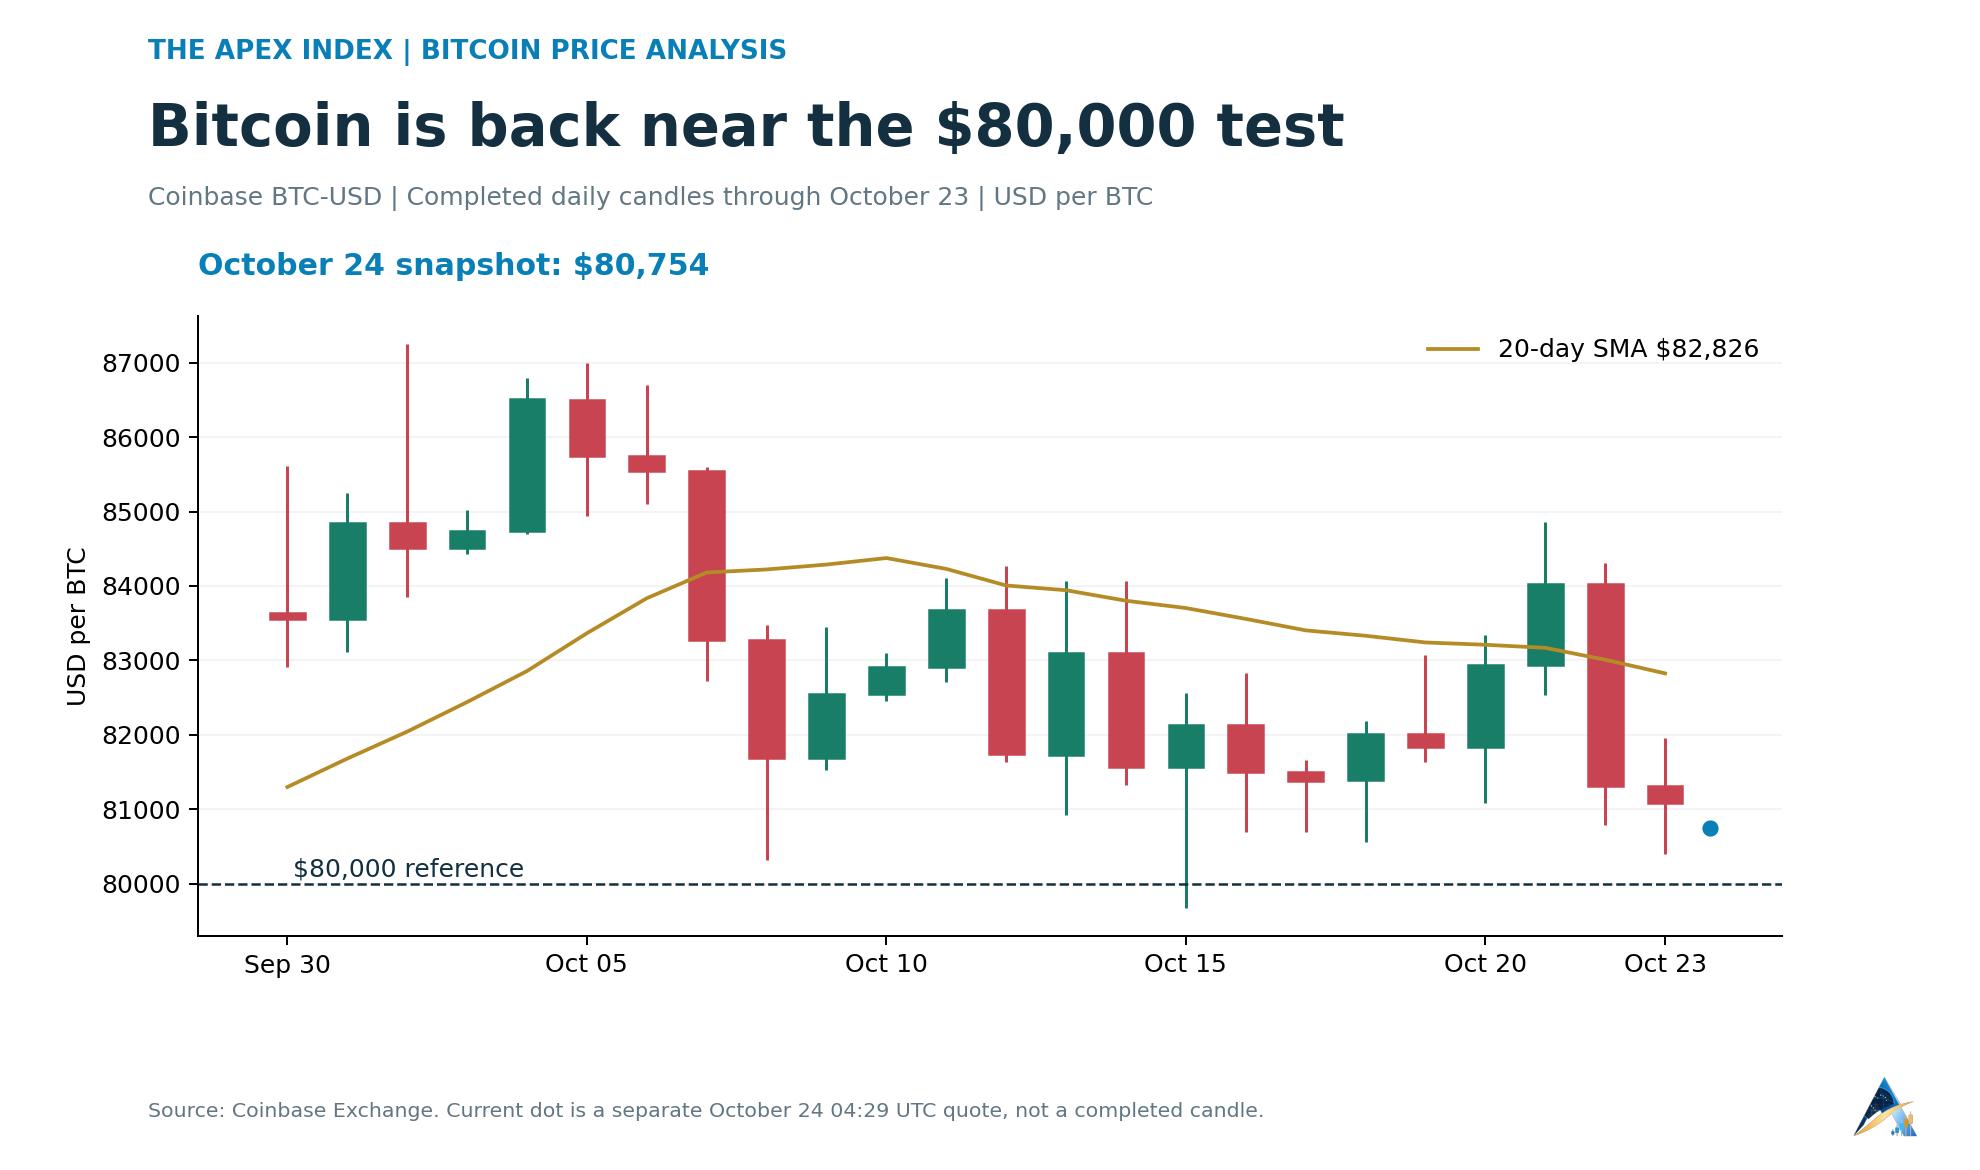
Crypto has shed roughly $237 billion since CoinMarketCap's October 2 reading. Three charts show the altcoin losses, Bitcoin's technical levels and the risks ahead of the Fed.
 Price Analysis
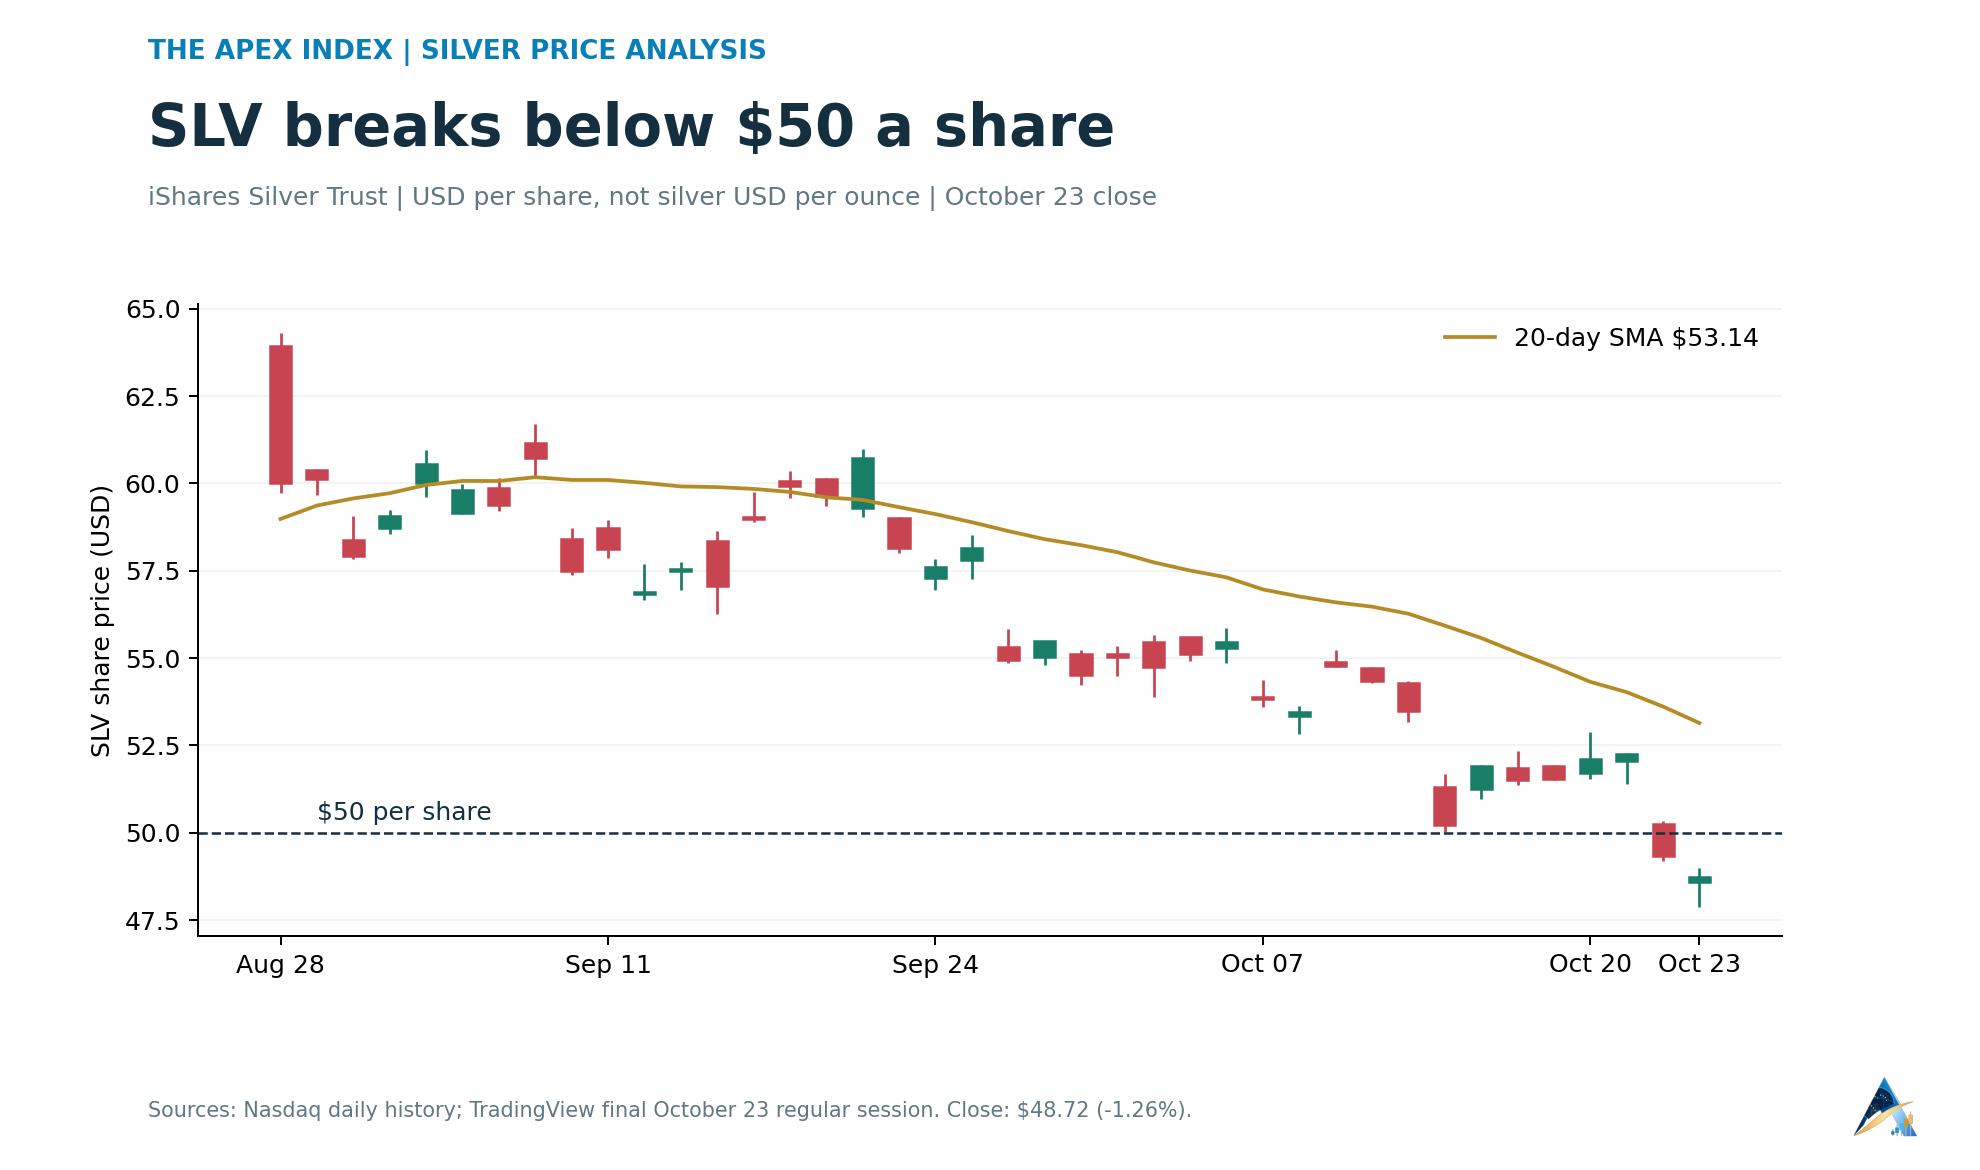
Silver is near $54 an ounce, while SLV has fallen below $50 a share. Three charts explain the downtrend, the supply deficit and what a recovery would require.
 Price Analysis
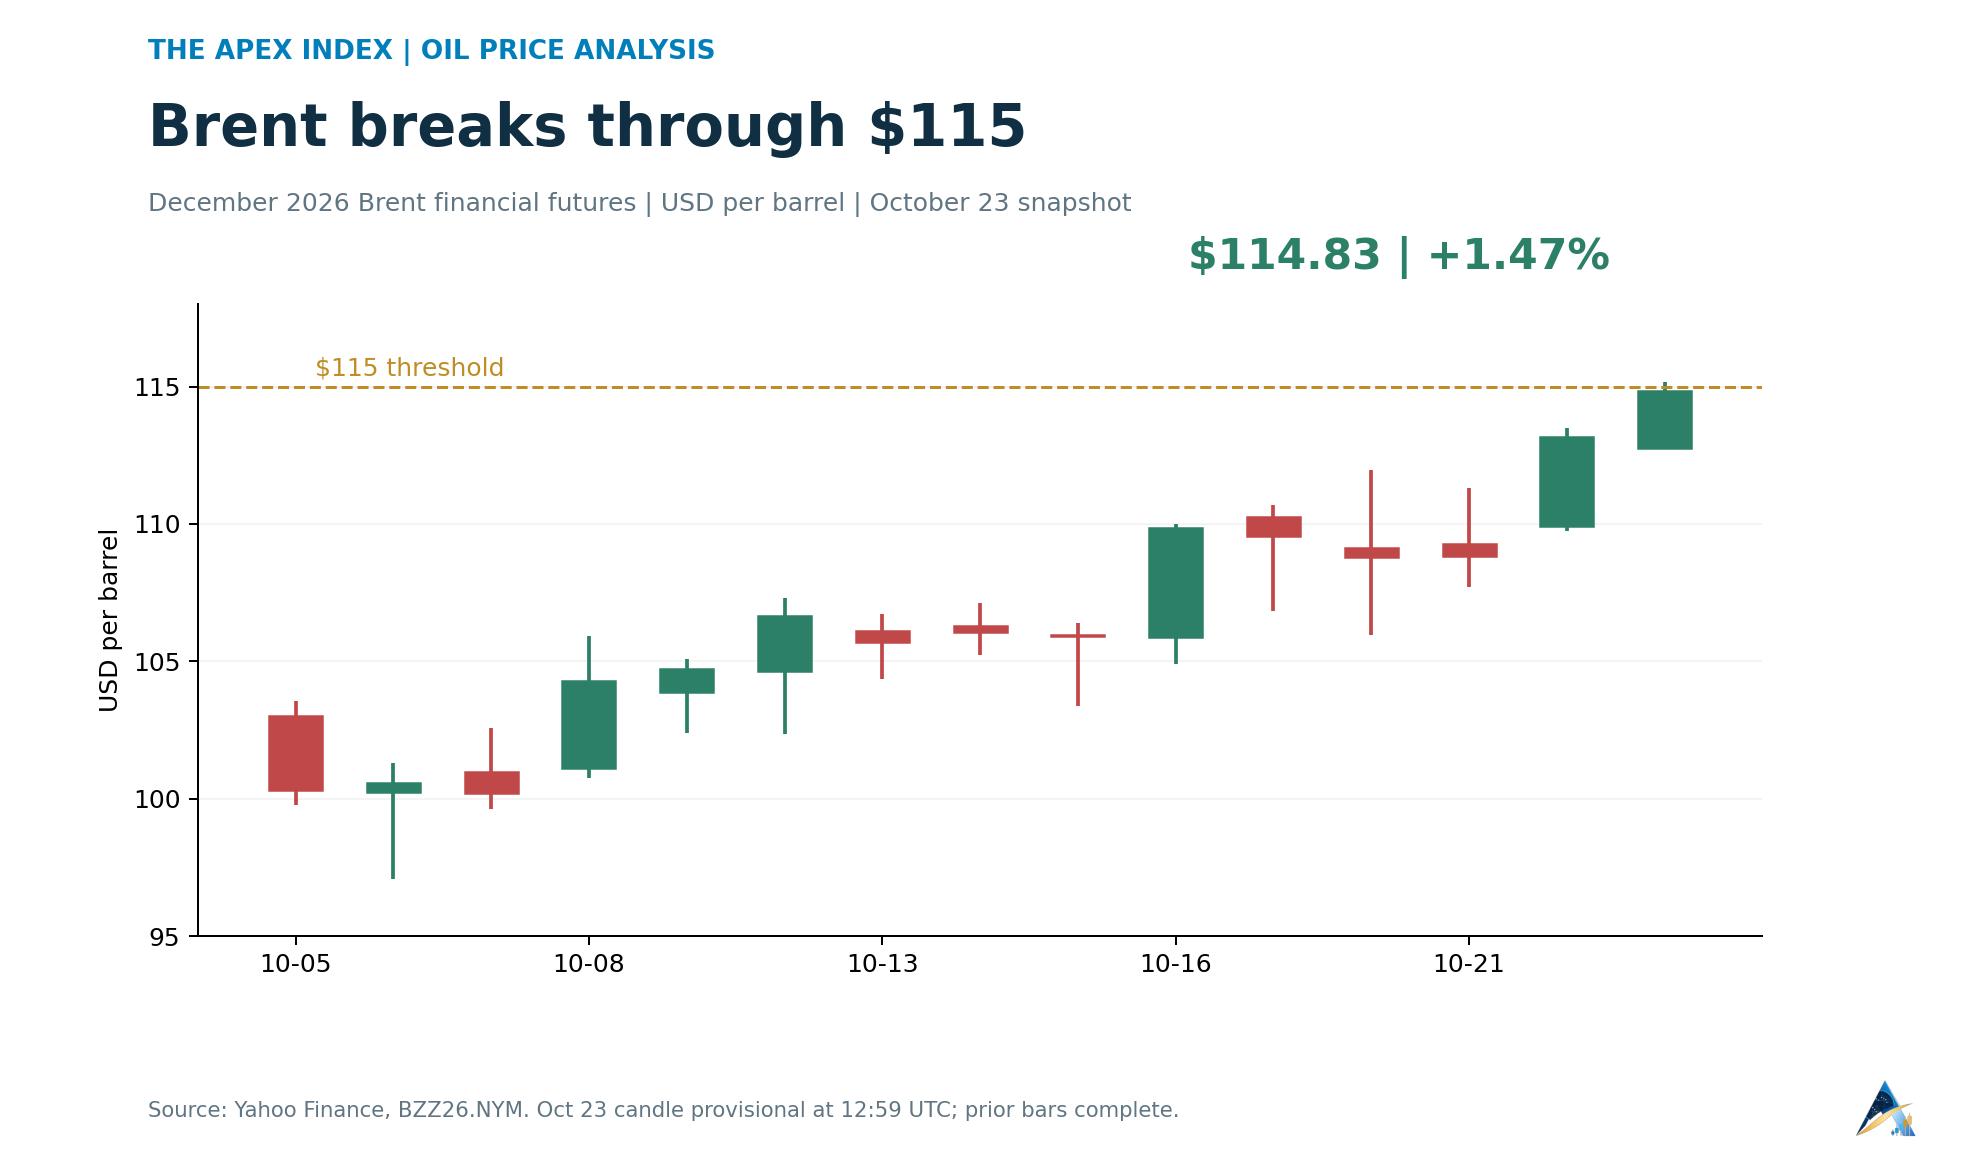
Brent crossed $115 as supply fears grew. Here is what the price charts, benchmark gap and latest inflation figures tell us about the risks ahead.
 Price Analysis
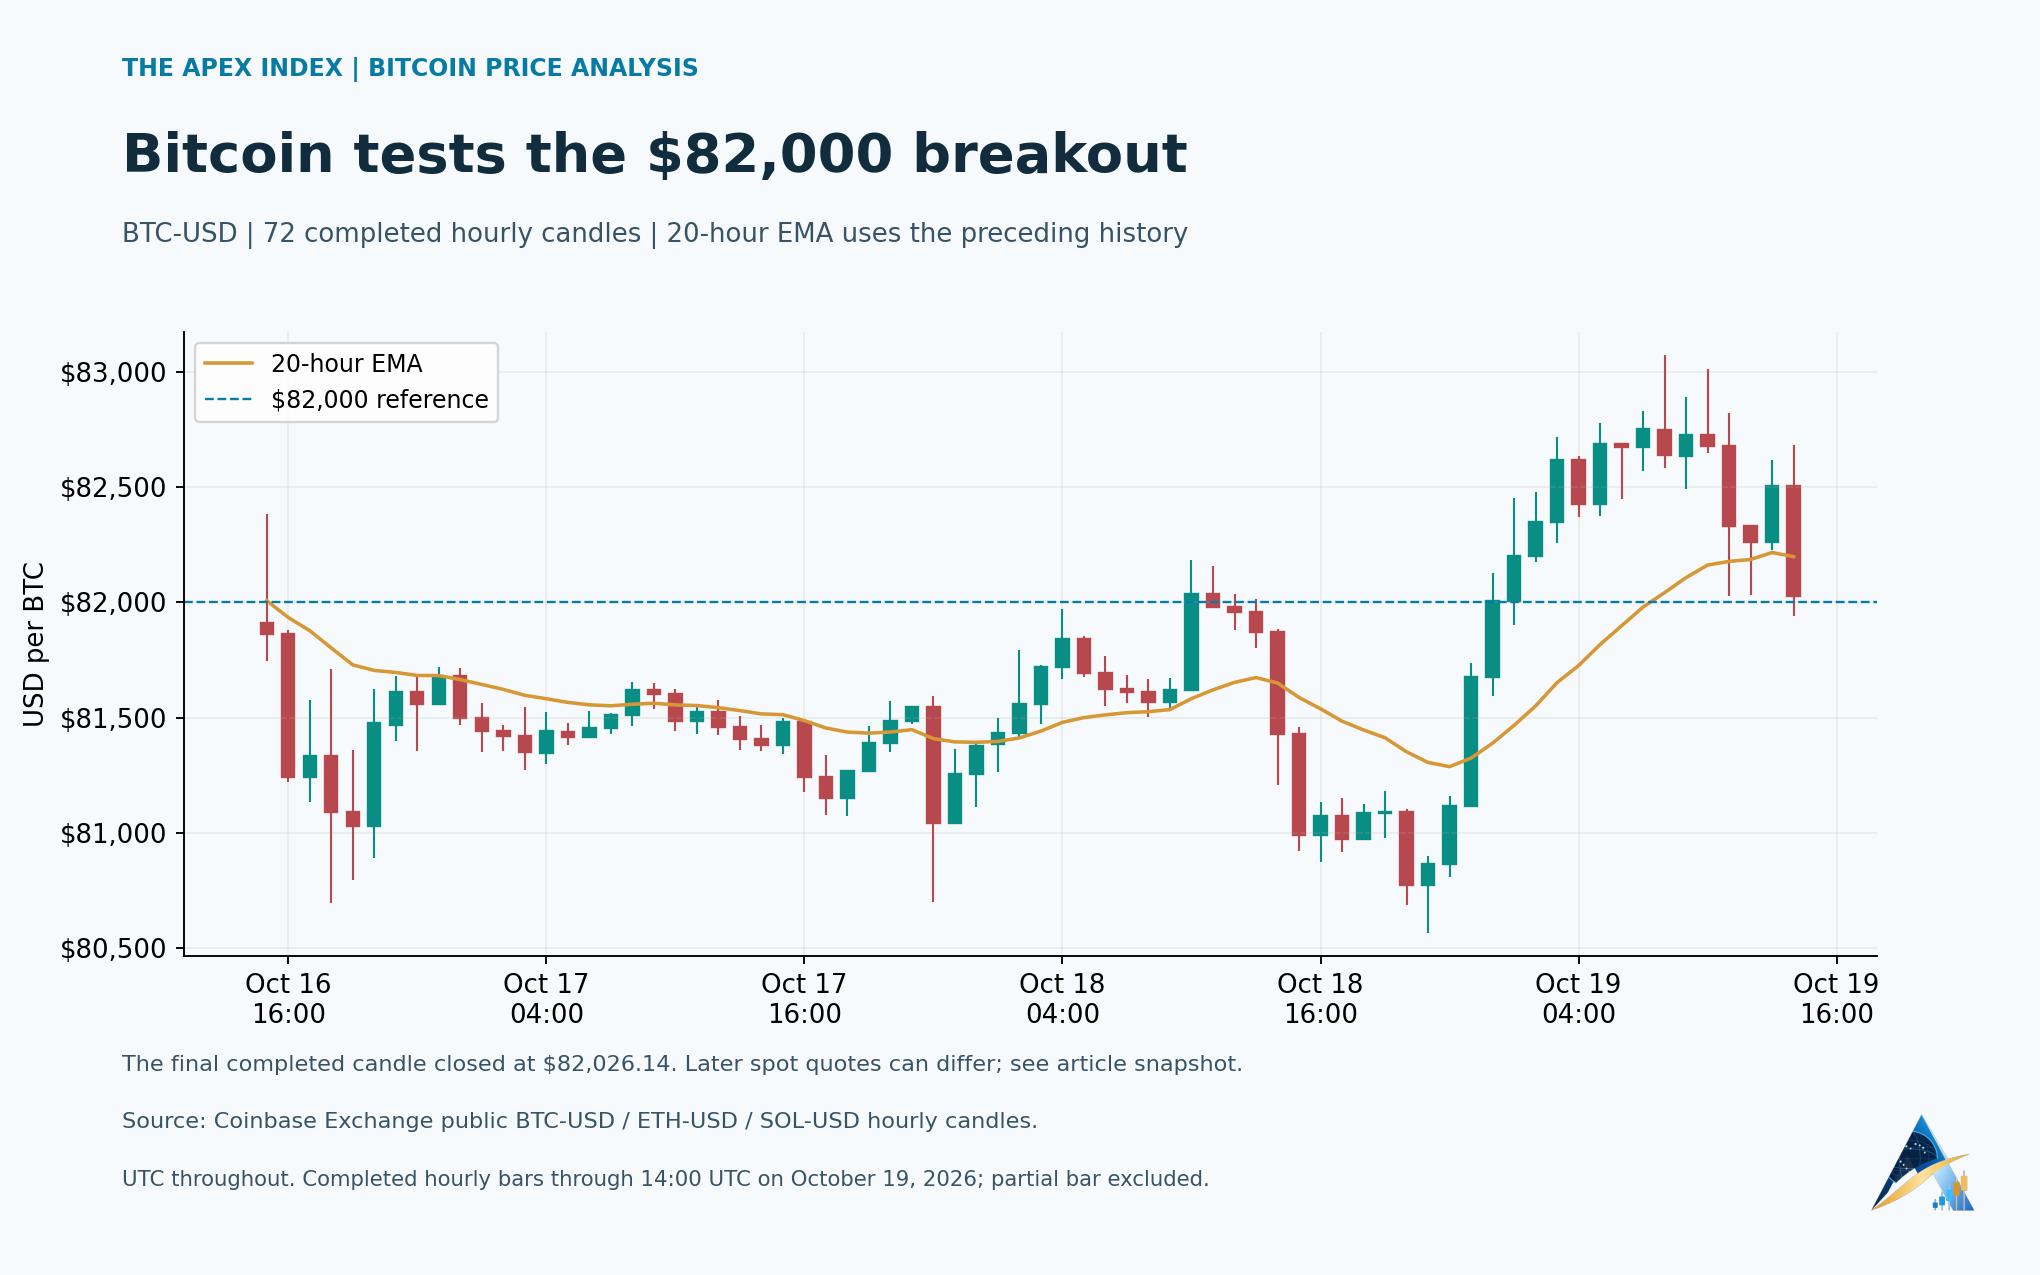
Bitcoin broke above $83,000 before slipping back under $82,000. Four charts track the breakout, trading volume, momentum and an uneven crypto recovery.
 Price Analysis
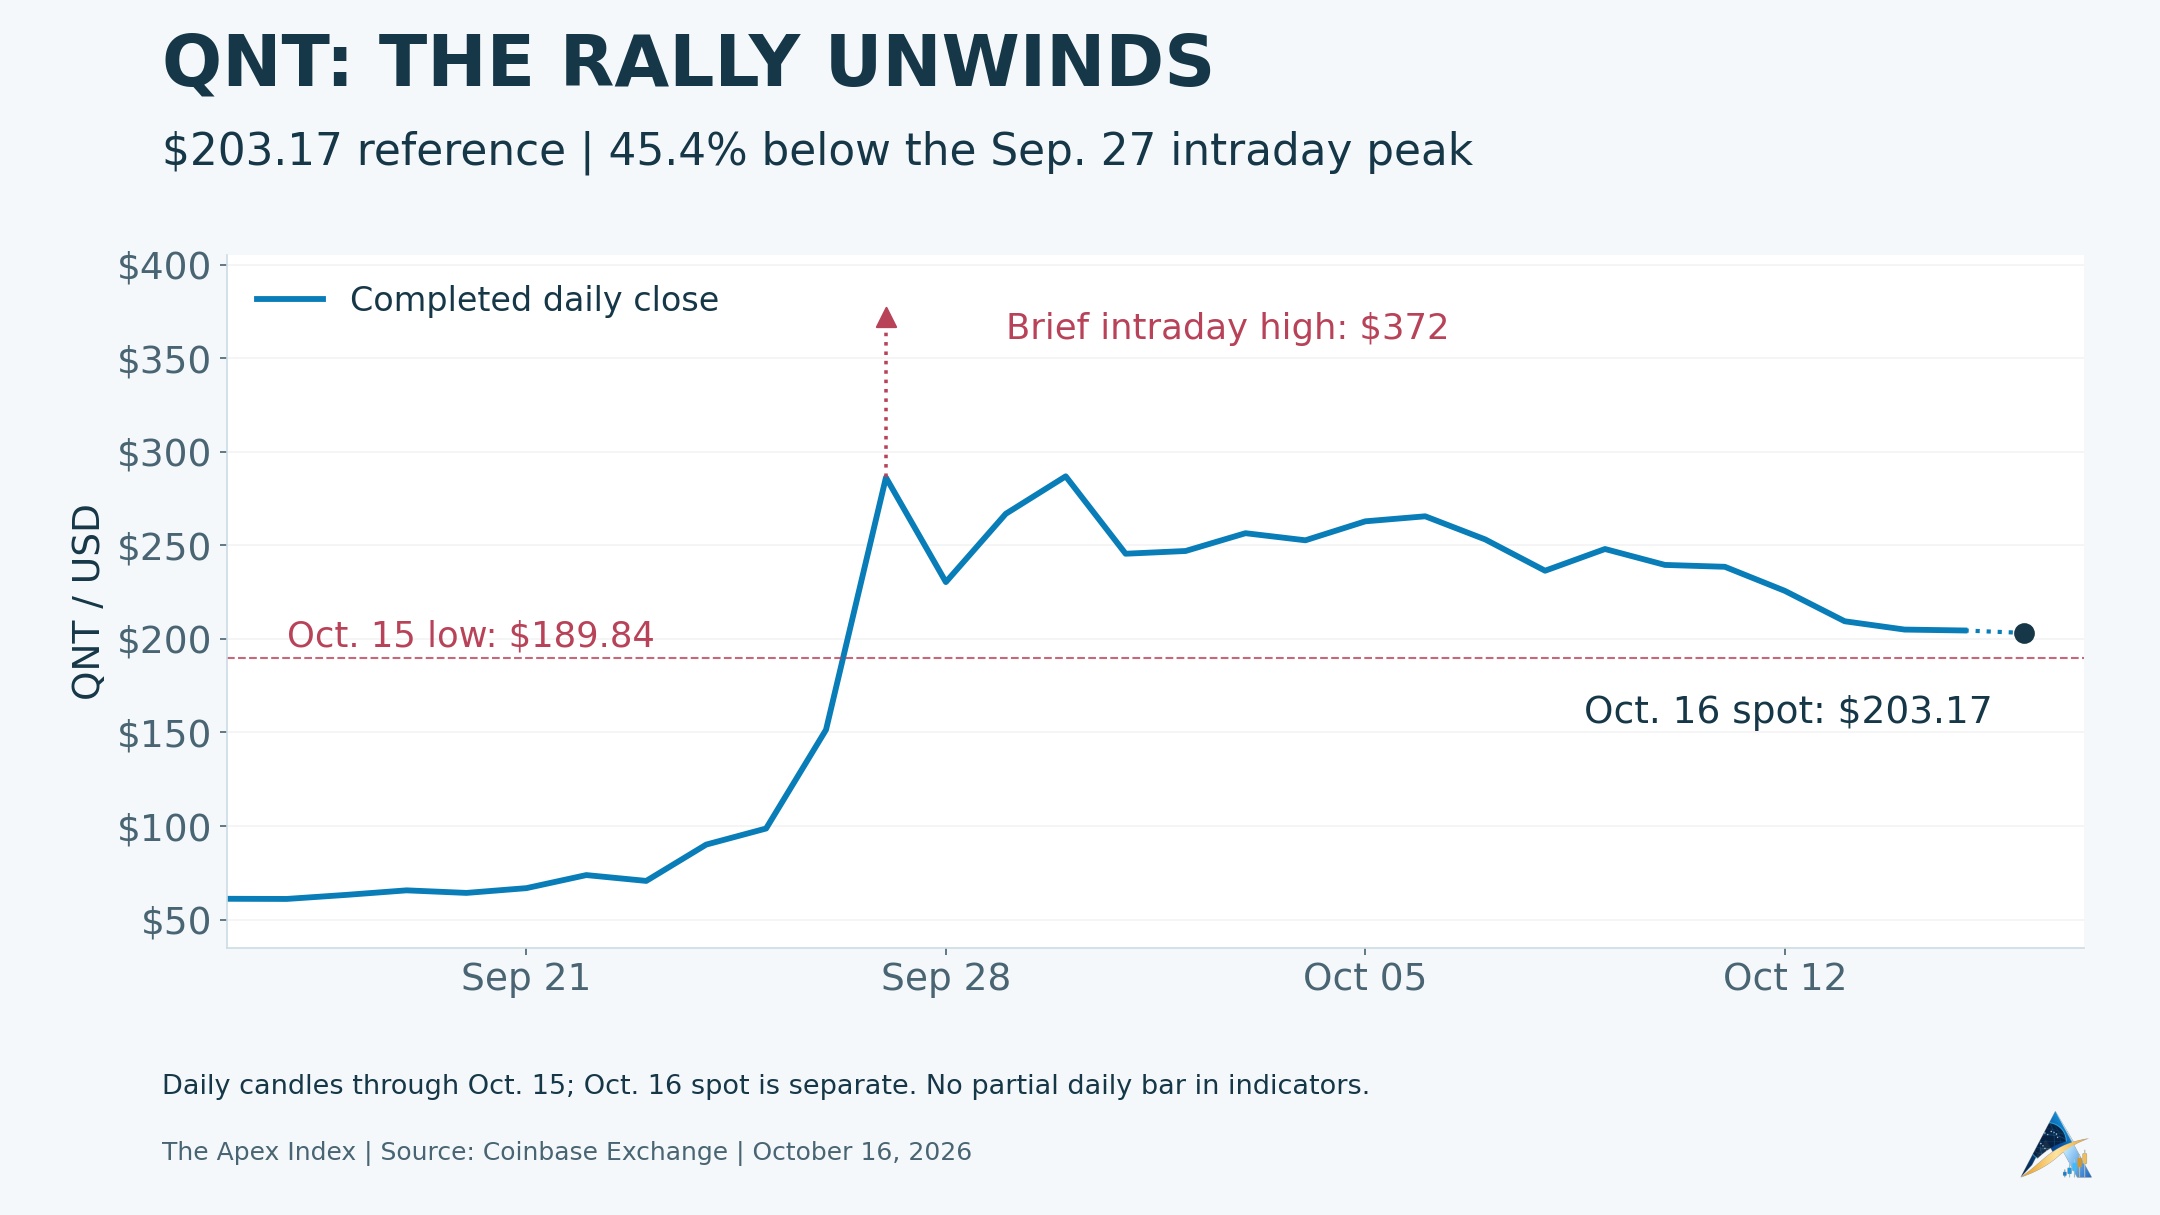
QNT has fallen about 45% from its brief September peak. The daily trend, fading rebound and $189.84 support explain what traders are watching next.
 Price Analysis
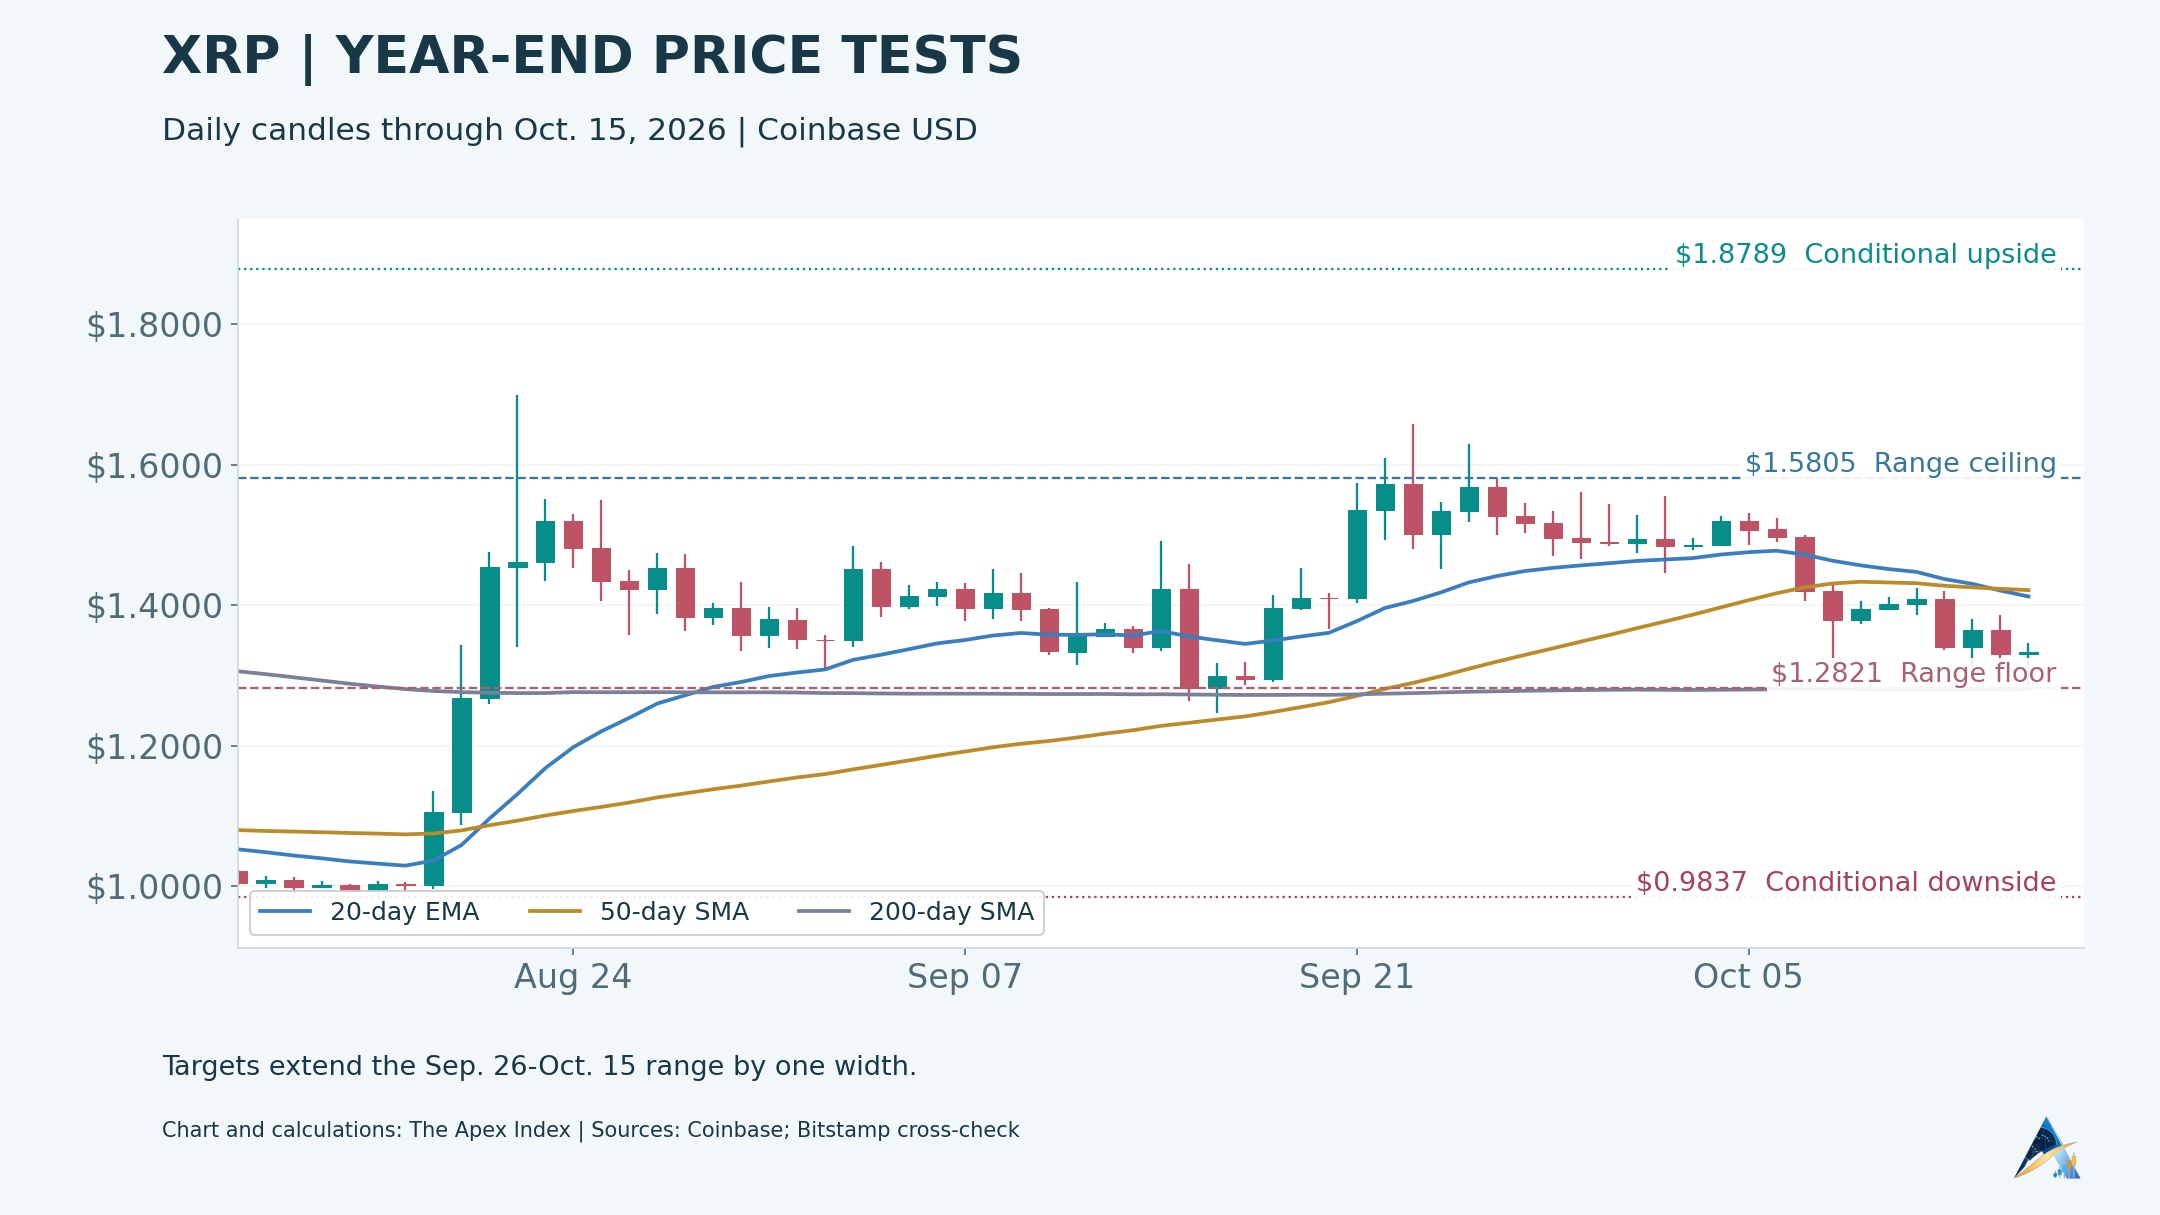
Updated October 16: XRP tests $1.2821 support as Apex recalculates momentum, positioning and conditional upside/downside levels.
 Price Analysis
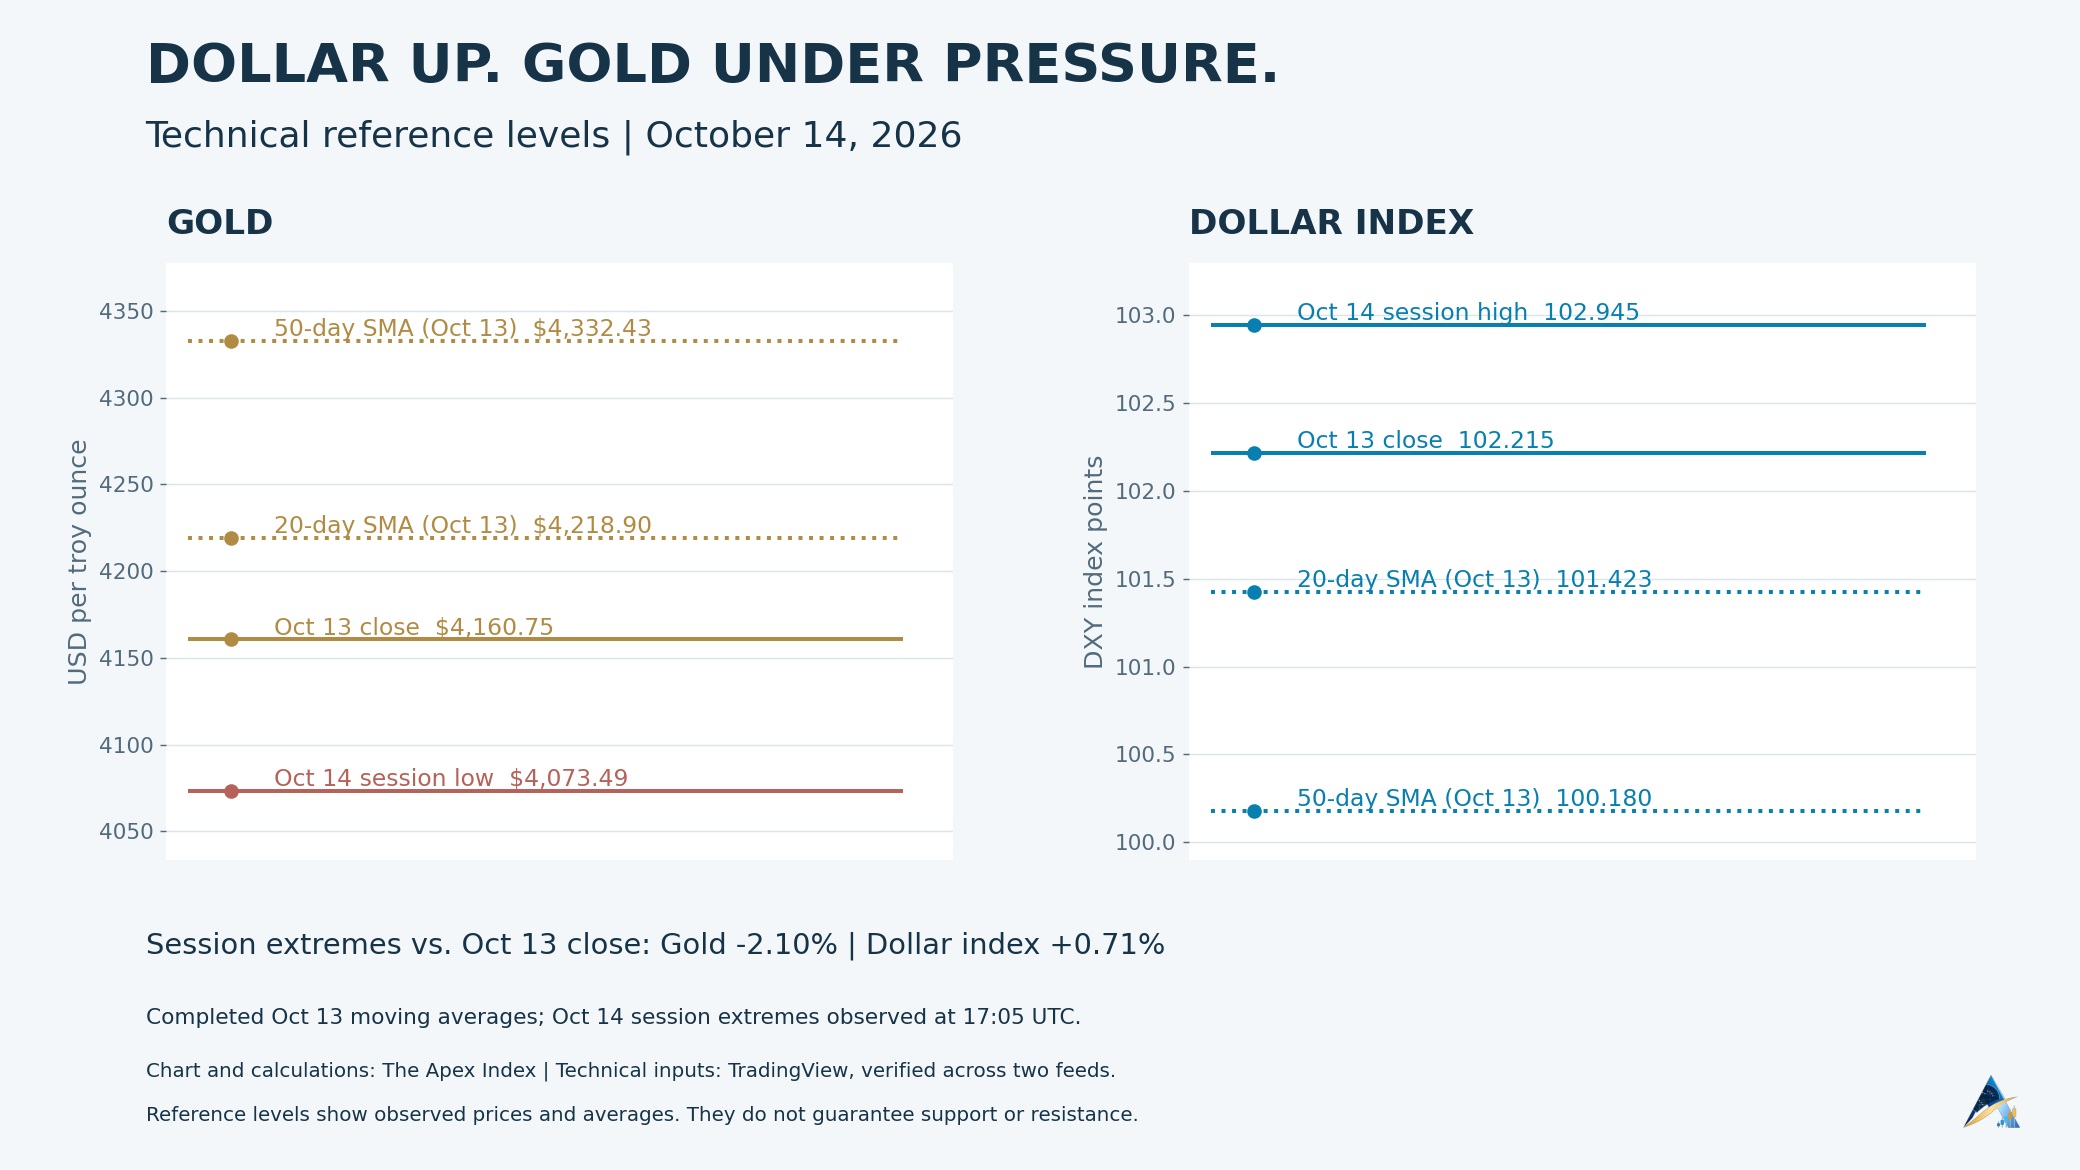
Hot September inflation strengthens the dollar and pushes gold below $4,100. Apex maps the recovery levels, downside risks and what would change the trade.
Verified inputs and calculations, conditional scenarios and clear risk levels. Data timestamps use UTC. Analysis is not investment advice.