
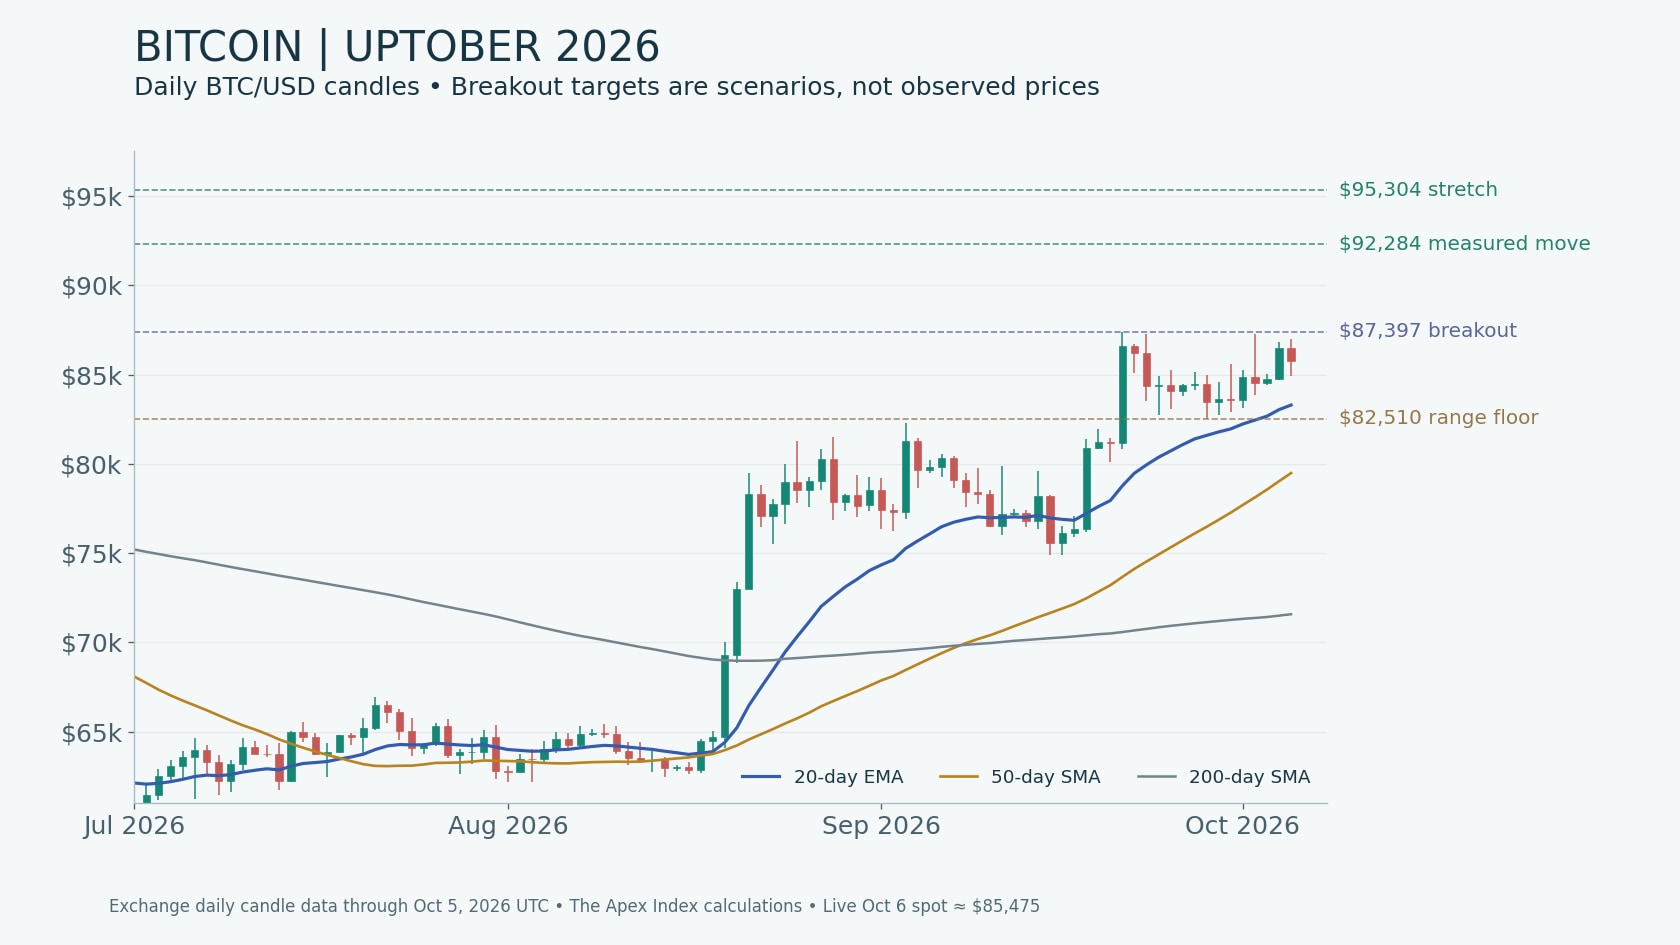
Bitcoin's October structure supports a conditional advance toward $92,300, with $95,300–$95,600 as the stretch zone if resistance becomes support. The operative trigger is a sustained daily breakout above $87,400. Until that occurs, the chart remains a consolidation inside an uptrend, rather than a confirmed continuation leg.
The CoinGecko spot snapshot placed Bitcoin at $85,475, updated October 6 at 19:22 UTC. Against the exchange's September 30 close of $83,556, that is an October gain of approximately 2.3%. All targets below concern the remainder of October 2026, rather than the full calendar year.
Trend, momentum and leveraged positioning
The TradingView daily technical feed for Bitstamp's BTC/USD pair showed a 20-day exponential moving average near $83,500, a 50-day simple moving average near $79,905 and a 200-day simple moving average near $71,657. Price above all three establishes a positive trend hierarchy. It does not establish that every intraday move higher is a breakout.
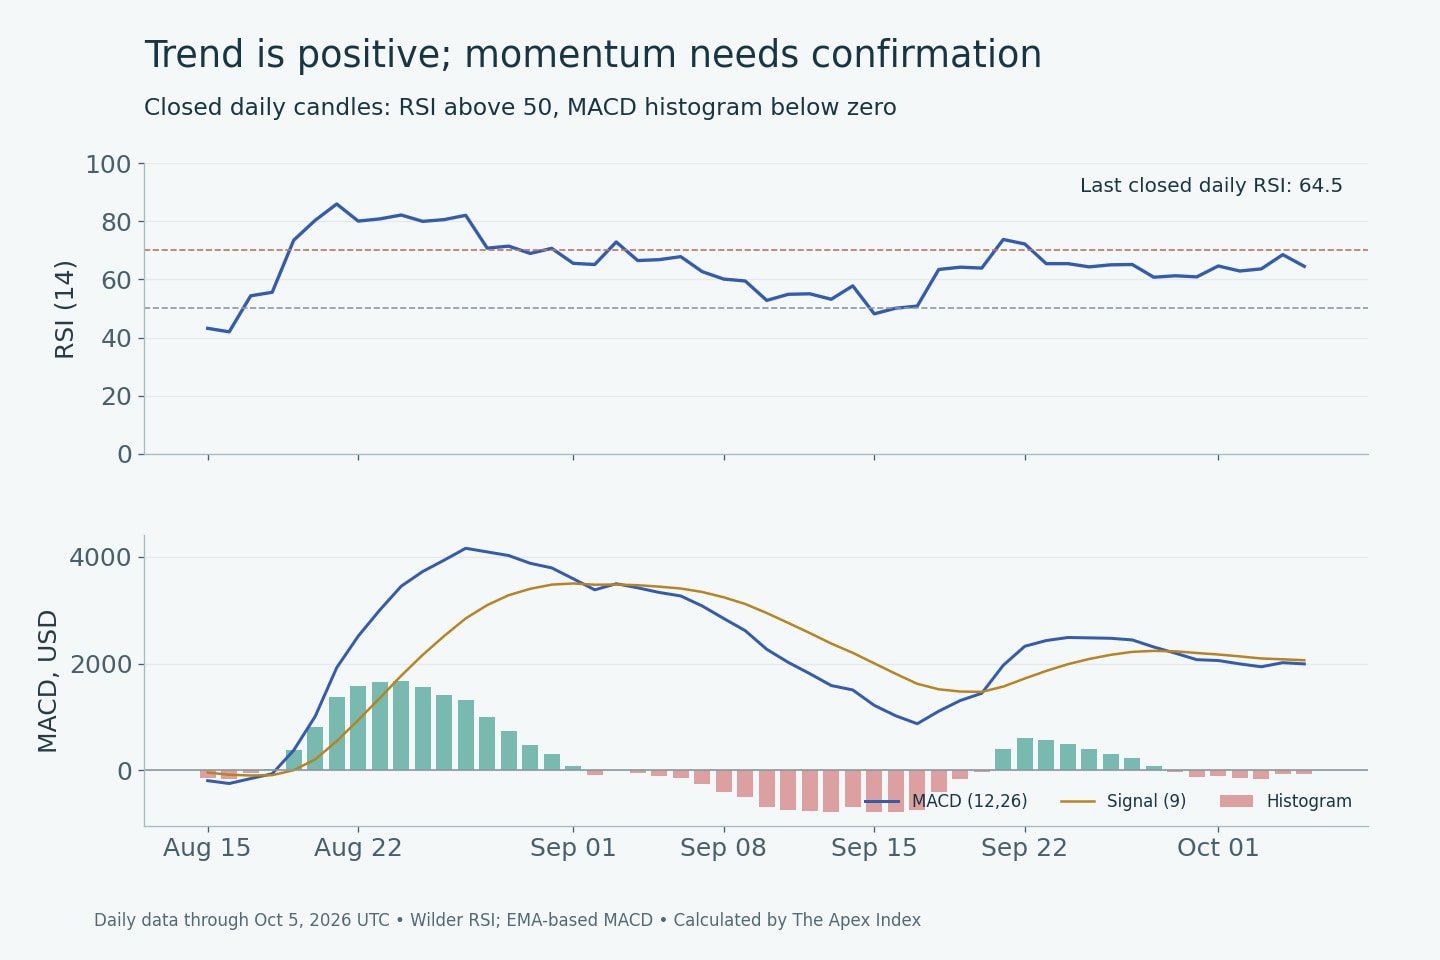
Daily RSI was approximately 63.0, above the neutral 50 threshold but below the conventional 70 overbought boundary. ADX was around 43.6, indicating strong directional persistence without specifying the direction independently. MACD was positive at approximately 1,930, yet below its nine-period signal near 2,036. Its roughly −105 histogram means the positive trend has lost some short-term acceleration.
The accompanying charts use Coinbase's BTC/USD daily candles, with the incomplete October 6 candle excluded from indicator calculations. The October 5 close was $85,749. On that closed-candle basis, RSI was 64.5 and the MACD histogram approximately −69. Differences from the live feed reflect the exchange, price timing and unfinished daily bar; the two sets should not be spliced into a single signal.
The relevant consolidation spans the September 21 high near $87,397 and the September 28 low near $82,510. Its width is approximately $4,887. The October 2 high near $87,249 approached the ceiling without establishing a breakout, while the October 5 close remained below it. A price wick above resistance would therefore be weaker evidence than a daily close above the ceiling followed by a successful retest.
Volatility defines the amount of room the setup needs. Closed-candle 14-day average true range was approximately $2,217. The $4,887 consolidation spans roughly 2.2 ATRs, while the $92,284 measured-move target sits roughly 3.1 ATRs above the spot reference. ATR measures recent trading ranges; it is neither a directional indicator nor a forecast confidence interval.
CoinGlass's derivatives snapshot showed approximately $55.64 billion of open interest, $49.30 billion in 24-hour futures turnover and $4.00 billion in tracked spot turnover. Futures turnover was about 12.3 times spot turnover within that provider's coverage. Those figures describe a derivatives-heavy market structure, not net bullish positioning. Open interest alone cannot identify whether a move is fueled by new longs, new shorts or hedged exposure.
For confirmation, the useful combination would be rising spot turnover, price acceptance above resistance and improving momentum. Rising open interest without corresponding spot participation would make a leverage-driven breakout more vulnerable to reversal. The retrieved snapshot does not establish current funding-rate direction or specific liquidation clusters, so neither is used to manufacture a target.
Uptober targets, confirmation and invalidation
Uptober is Bitcoin's established October seasonality pattern. Using the same exchange's September 30 and October 31 UTC closes for 2015–2025, nine of eleven completed Octobers were positive. The median return was approximately 14.4%, versus a mean near 19.1%. The 2018 and 2025 observations were negative, demonstrating that the pattern has exceptions.
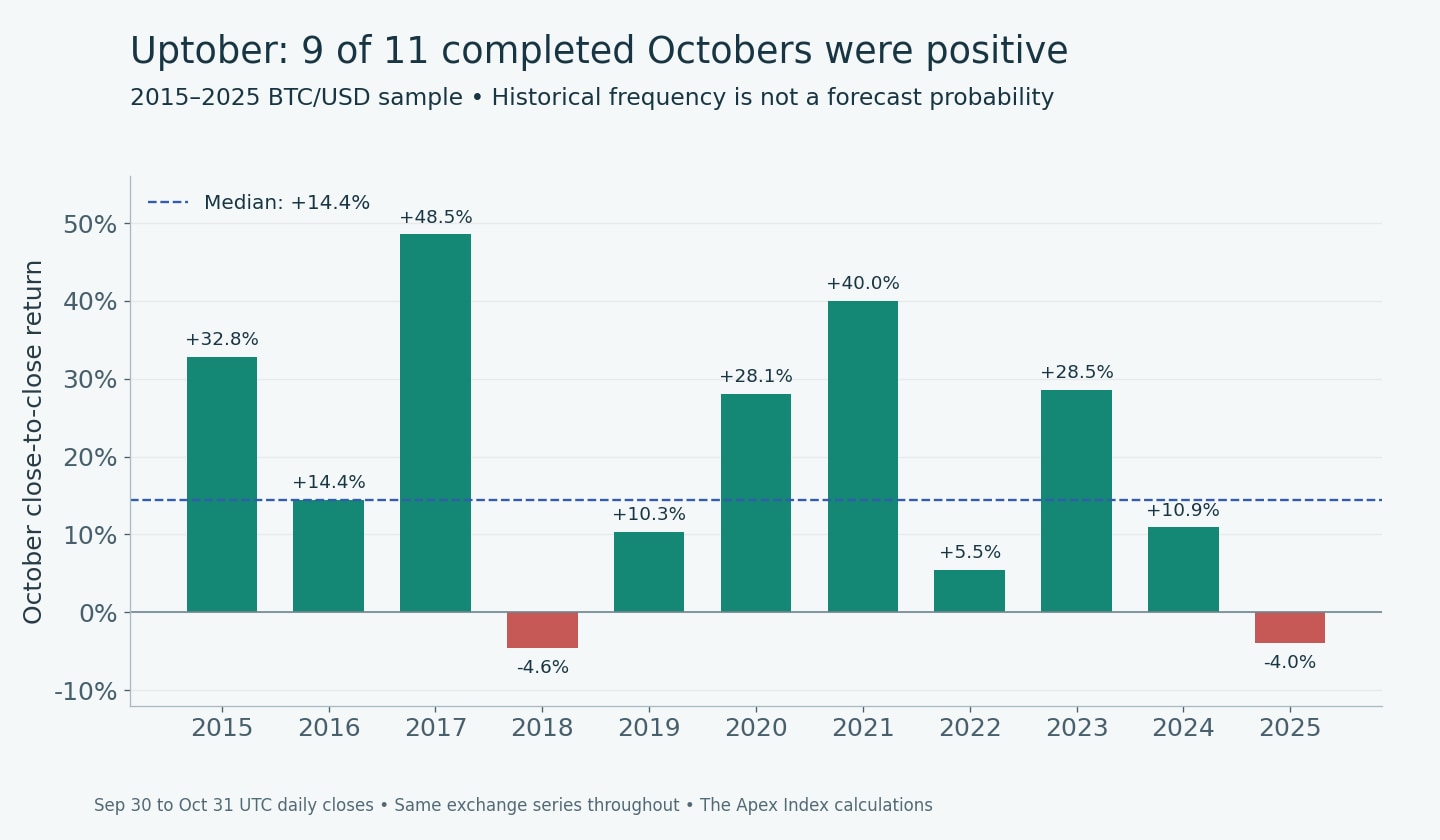
A mechanical application of that median to the $83,556 September close produces approximately $95,618. The higher mean would imply approximately $99,544, but large historical rallies lift the mean substantially. Eleven observations across different market regimes do not justify treating the positive-year frequency as this October's success probability. Seasonality strengthens the context for a bullish setup; it does not replace price confirmation.
The first hurdle after a confirmed $87,400 breakout is approximately $88,500–$89,000, corresponding to the live and closed-candle upper Bollinger bands, using a 20-period average and two standard deviations. These bands are dynamic statistical envelopes, not fixed sell walls. A sustained move along an expanding upper band can indicate trend strength; an immediate return inside the range would suggest rejection.
The primary continuation target is calculated as $87,397 + ($87,397 − $82,510), giving approximately $92,284. The stretch extension adds 1.618 times the same range width above its ceiling, producing approximately $95,304. That extension and the historical-median projection define the $95,300–$95,600 zone. They are two analytical lenses, not independent statistical proof.
The bull scenario requires daily acceptance above $87,400, a retest that holds and renewed momentum. A MACD histogram turning positive would strengthen that case. Spot volume exceeding its recent average would add confirmation; the closed-candle 20-day average was approximately 6,275 BTC on the exchange used for the charts. This threshold must be compared with a completed daily bar, not a partial session.
The unresolved scenario is continued rotation between approximately $82,500 and $87,400. In that regime, $92,300 remains an unactivated target. The initial support area is the roughly $83,300–$83,500 20-day EMA zone. A daily close below $82,500 that is not promptly reclaimed invalidates this consolidation's upside setup and shifts attention toward the approximately $79,500–$79,900 50-day average zone.
Reaching $100,000 would require about 17% upside from the spot reference and acceptance beyond the stretch zone. It is an extension beyond this setup's primary targets, not the central October forecast. The decision points remain the breakout, participation and support tests above. The charts are dated analytical snapshots; the linked provider pages supply updating market views.