

Silver's road back to $120 has become a lot longer. The metal was quoted at $53.90 a troy ounce in the October 23 snapshot retrieved at 23:29 UTC, down 1.26% on the session. Buyers hoping the latest drop would finally bring a bargain have another question to answer first: where will the selling stop?
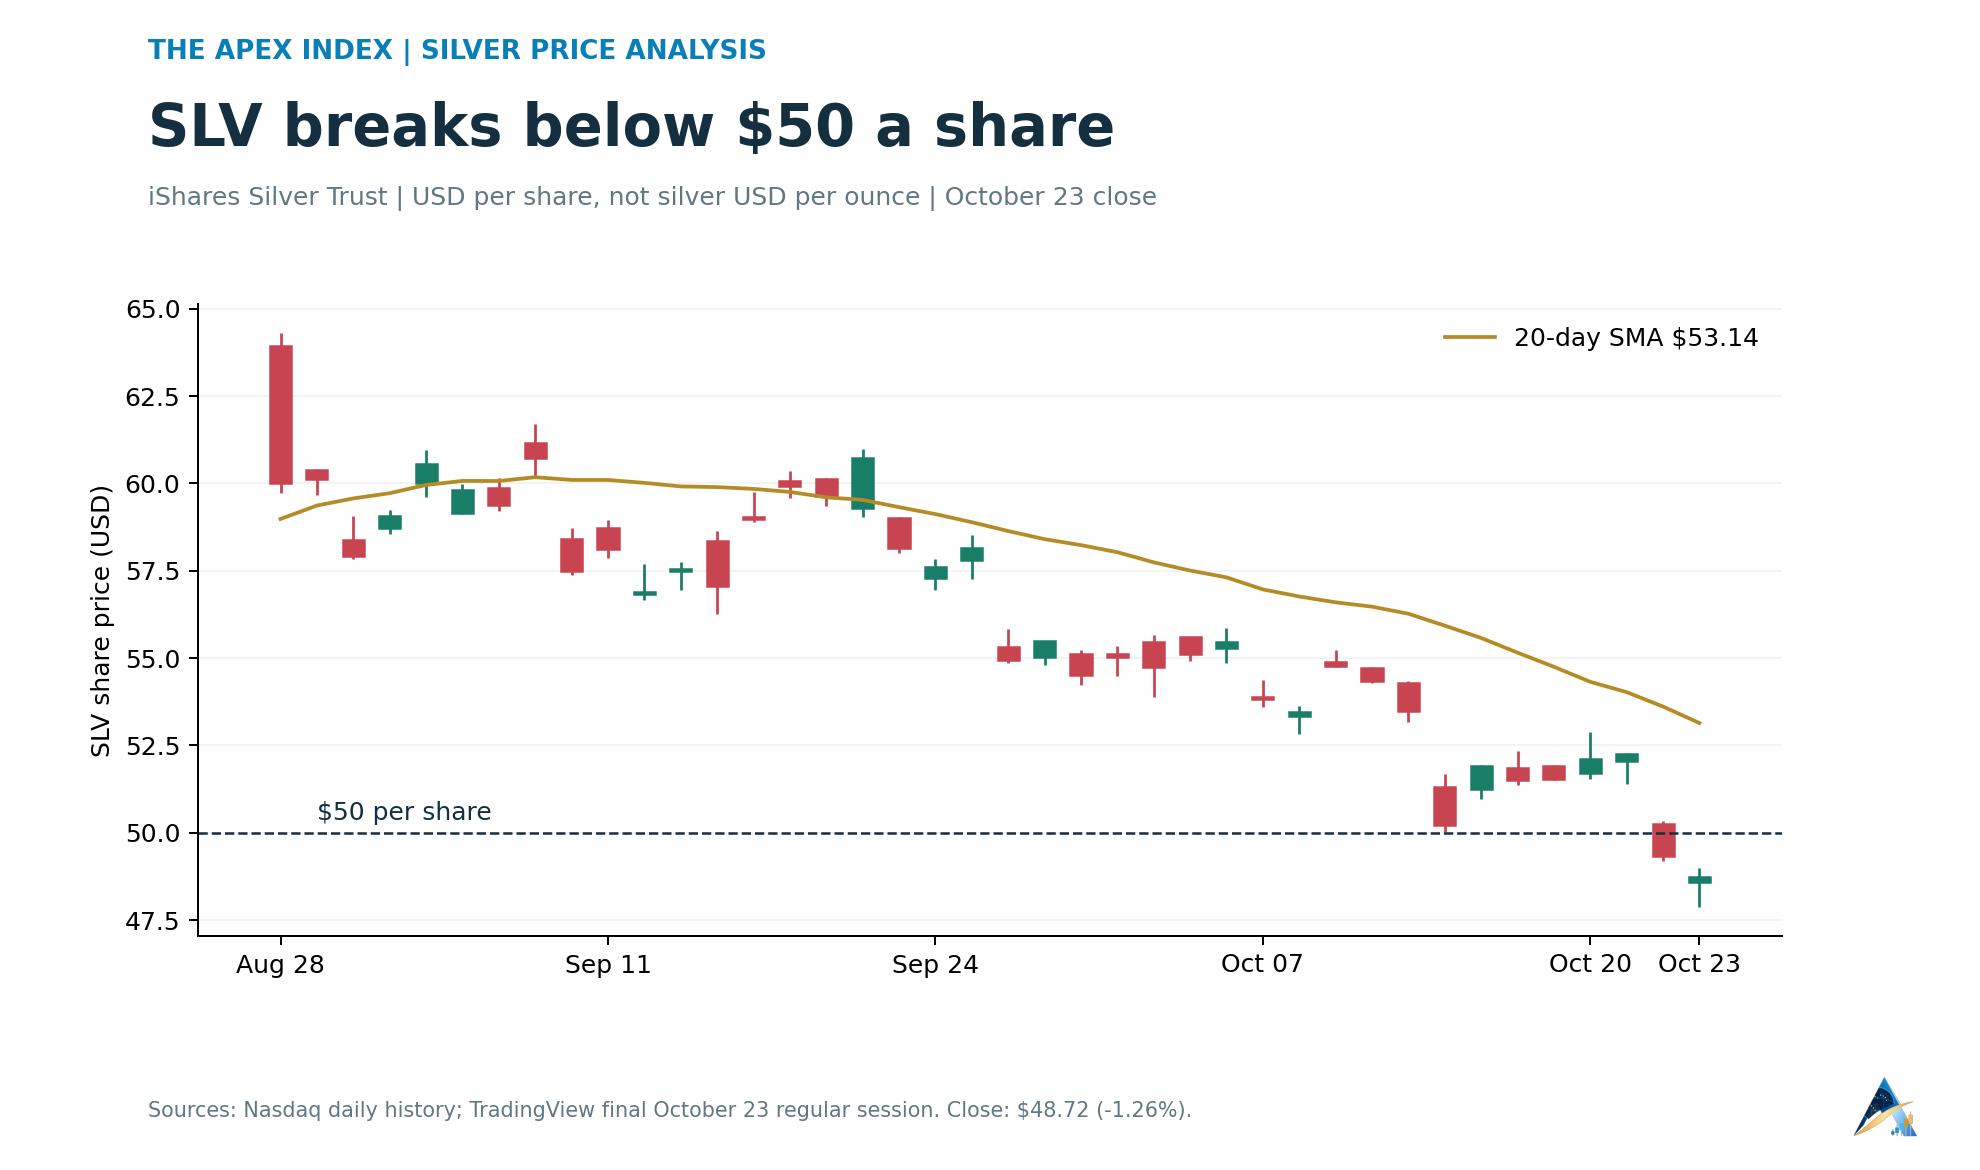
The iShares Silver Trust, or SLV, closed Friday at $48.72 per share, down 1.26%. It lost 5.42% over the week and 11.45% from the October 1 close. The fund has crossed below $50, while bullion itself remains above that level. A share of SLV and an ounce of silver have different prices.
How far away is $120 now?
Silver actually traded above $121 on January 29, according to the Silver Institute's April market review. That makes the $120 discussion a question of recovering lost ground. From the latest quote, reaching that price would require a gain of 122.63%.
The immediate numbers are much less ambitious. TradingView's spot quote showed a session low of $53.031 and a high of $54.735. Holding around $53 would give buyers somewhere to attempt a recovery. A break below the low would leave the round-number $50 area as the next obvious test, another 7.24% below $53.90.
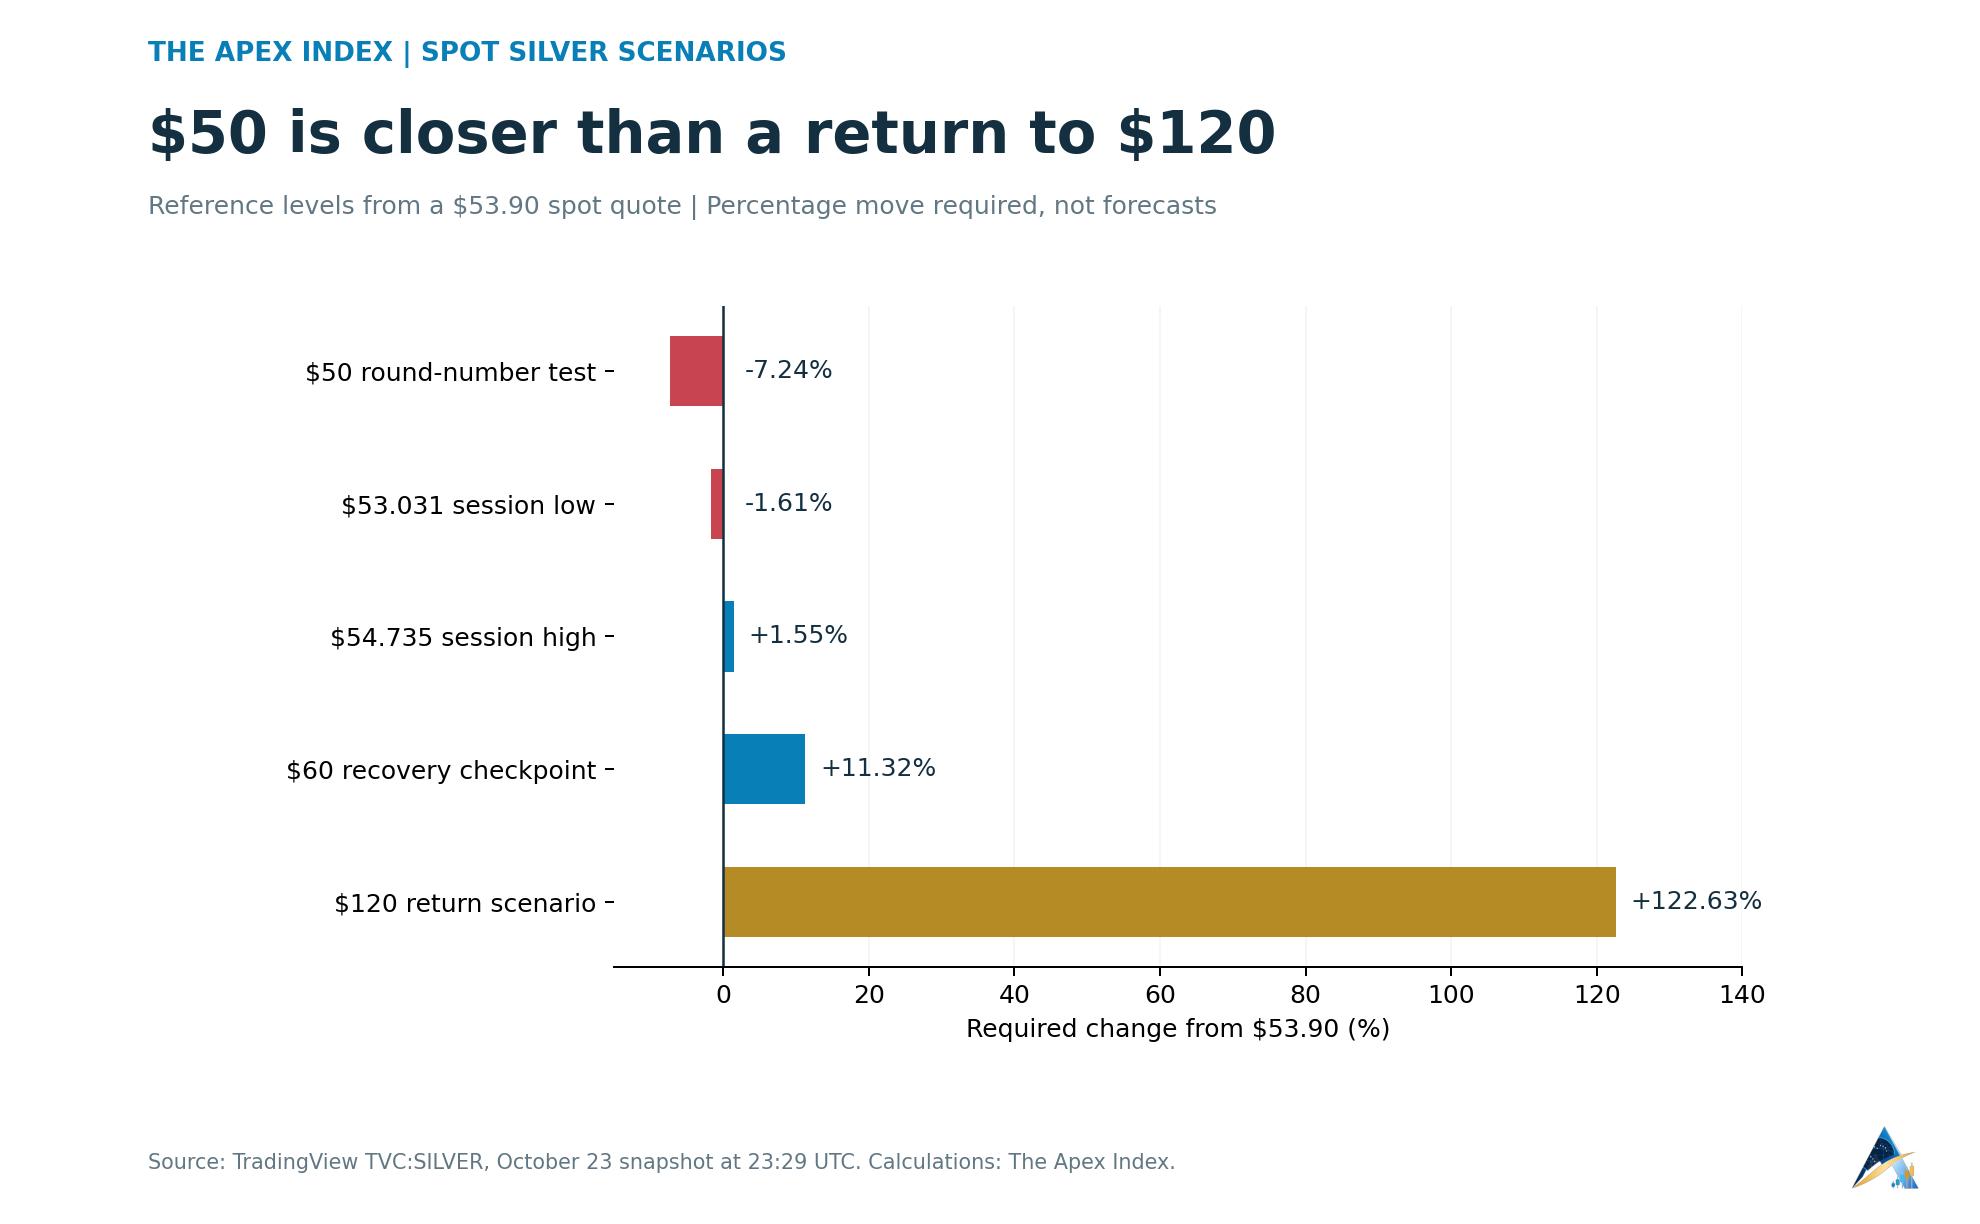
Getting back above $54.74 would be an initial improvement. Reclaiming $55 and then holding above $60 would do more to change the conversation. Those are conditional checkpoints, with $60 representing an 11.32% gain from the snapshot, rather than a prediction that silver will reach it. A rebound that stalls below Friday's high would leave sellers with little reason to worry.
Why silver is having such a rough time
Silver pays no interest, competes with interest-bearing assets and is priced internationally in dollars. A stronger dollar makes the metal more expensive for buyers using other currencies. In the same October 23 market snapshot, the dollar index stood at 101.751, up 0.13%, while gold was down 0.71% at $3,995.54 an ounce. The pressure extended across precious metals.
Inflation complicates the usual argument for buying bullion. Investors may want protection against rising prices, but they also have to consider whether those prices will keep interest rates higher. As Apex previously reported, December Brent futures reached $115.16 on October 23. September's U.S. consumer inflation rate had already risen to 3.7%. Expensive energy adds another obstacle to hopes for easier monetary policy.
Silver also has factories to worry about. Its industrial uses include electronics, solar panels and vehicles, giving it exposure to manufacturing demand alongside investment demand. That helps during an industrial expansion. It becomes a problem when manufacturers find ways to use less metal or buyers become more cautious.
The shortage argument has a catch
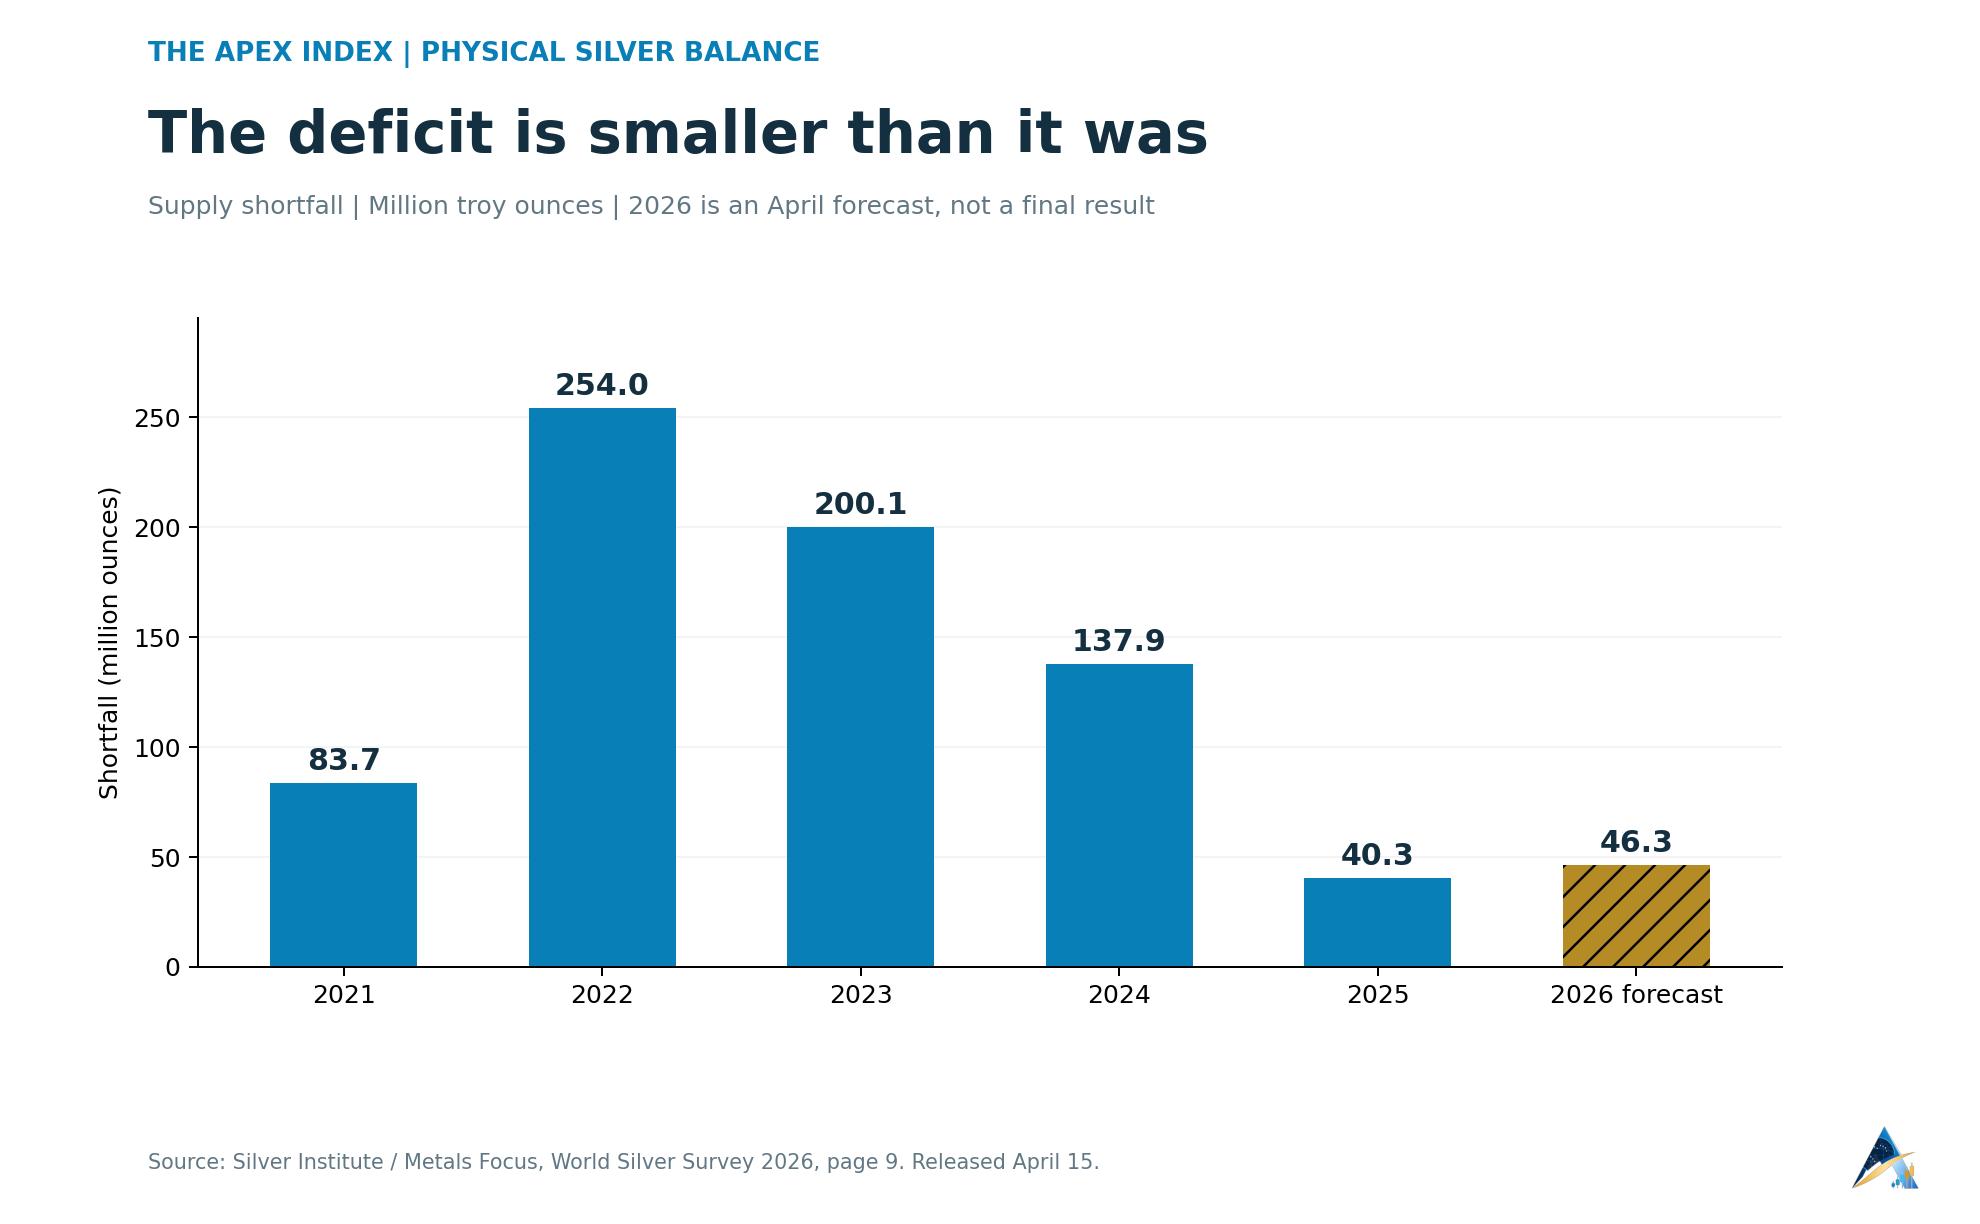
The World Silver Survey 2026, published in April and researched by Metals Focus, forecast a sixth consecutive annual supply deficit. Its estimate was 46.3 million ounces for 2026, compared with a 40.3 million-ounce shortfall in 2025. These are the annual report's estimates, with the current year's final outcome still unknown.
That supports the argument that existing stocks must help meet demand. It doesn't give investors a date when prices must rise. The projected shortfall is also far smaller than the 254 million ounces recorded in 2022 or the 200.1 million ounces in 2023.
The detailed survey forecast industrial demand of 639.6 million ounces, down from 657.4 million in 2025. Within that total, photovoltaic demand was expected to fall from 186.6 million to 151 million ounces, a 19.1% decline. Solar manufacturers have been reducing the amount of silver they use and substituting other materials.
The April outlook put it plainly:
"Industrial demand is projected to decline by 3 percent, chiefly due to a further and marked slowdown in PV offtake."
There were offsets. Coin and net bar demand was forecast to rise 18.3% to 257.6 million ounces. Recycling was expected to increase from 197.6 million to 211.3 million ounces, adding supply as owners sold metal back into the market. Demand, recycling and inventory releases all matter to the price buyers will pay.
On new mine output, the same outlook said:
"Global silver mine production is expected to remain flat in 2026."
That leaves a mixed picture: constrained mine growth, weaker industrial consumption and stronger projected physical investment. Buying solely because someone mentions a shortage skips most of that picture.
What the silver fund's chart is saying
For a separately tradable view of the selloff, SLV's daily chart gives investors a clear set of reference levels. The trust seeks to track silver bullion, though its sponsor charges an annual fee of 0.50%. Its share-price indicators below are calculated from Nasdaq daily history and the completed October 23 regular session.
SLV finished below its 20-day simple moving average of $53.14, its 50-day average of $56.99 and its 200-day average of $64.96. The shorter averages are below the longer ones. That is a bearish trend structure across the three windows, with a substantial recovery needed before buyers can claim control.
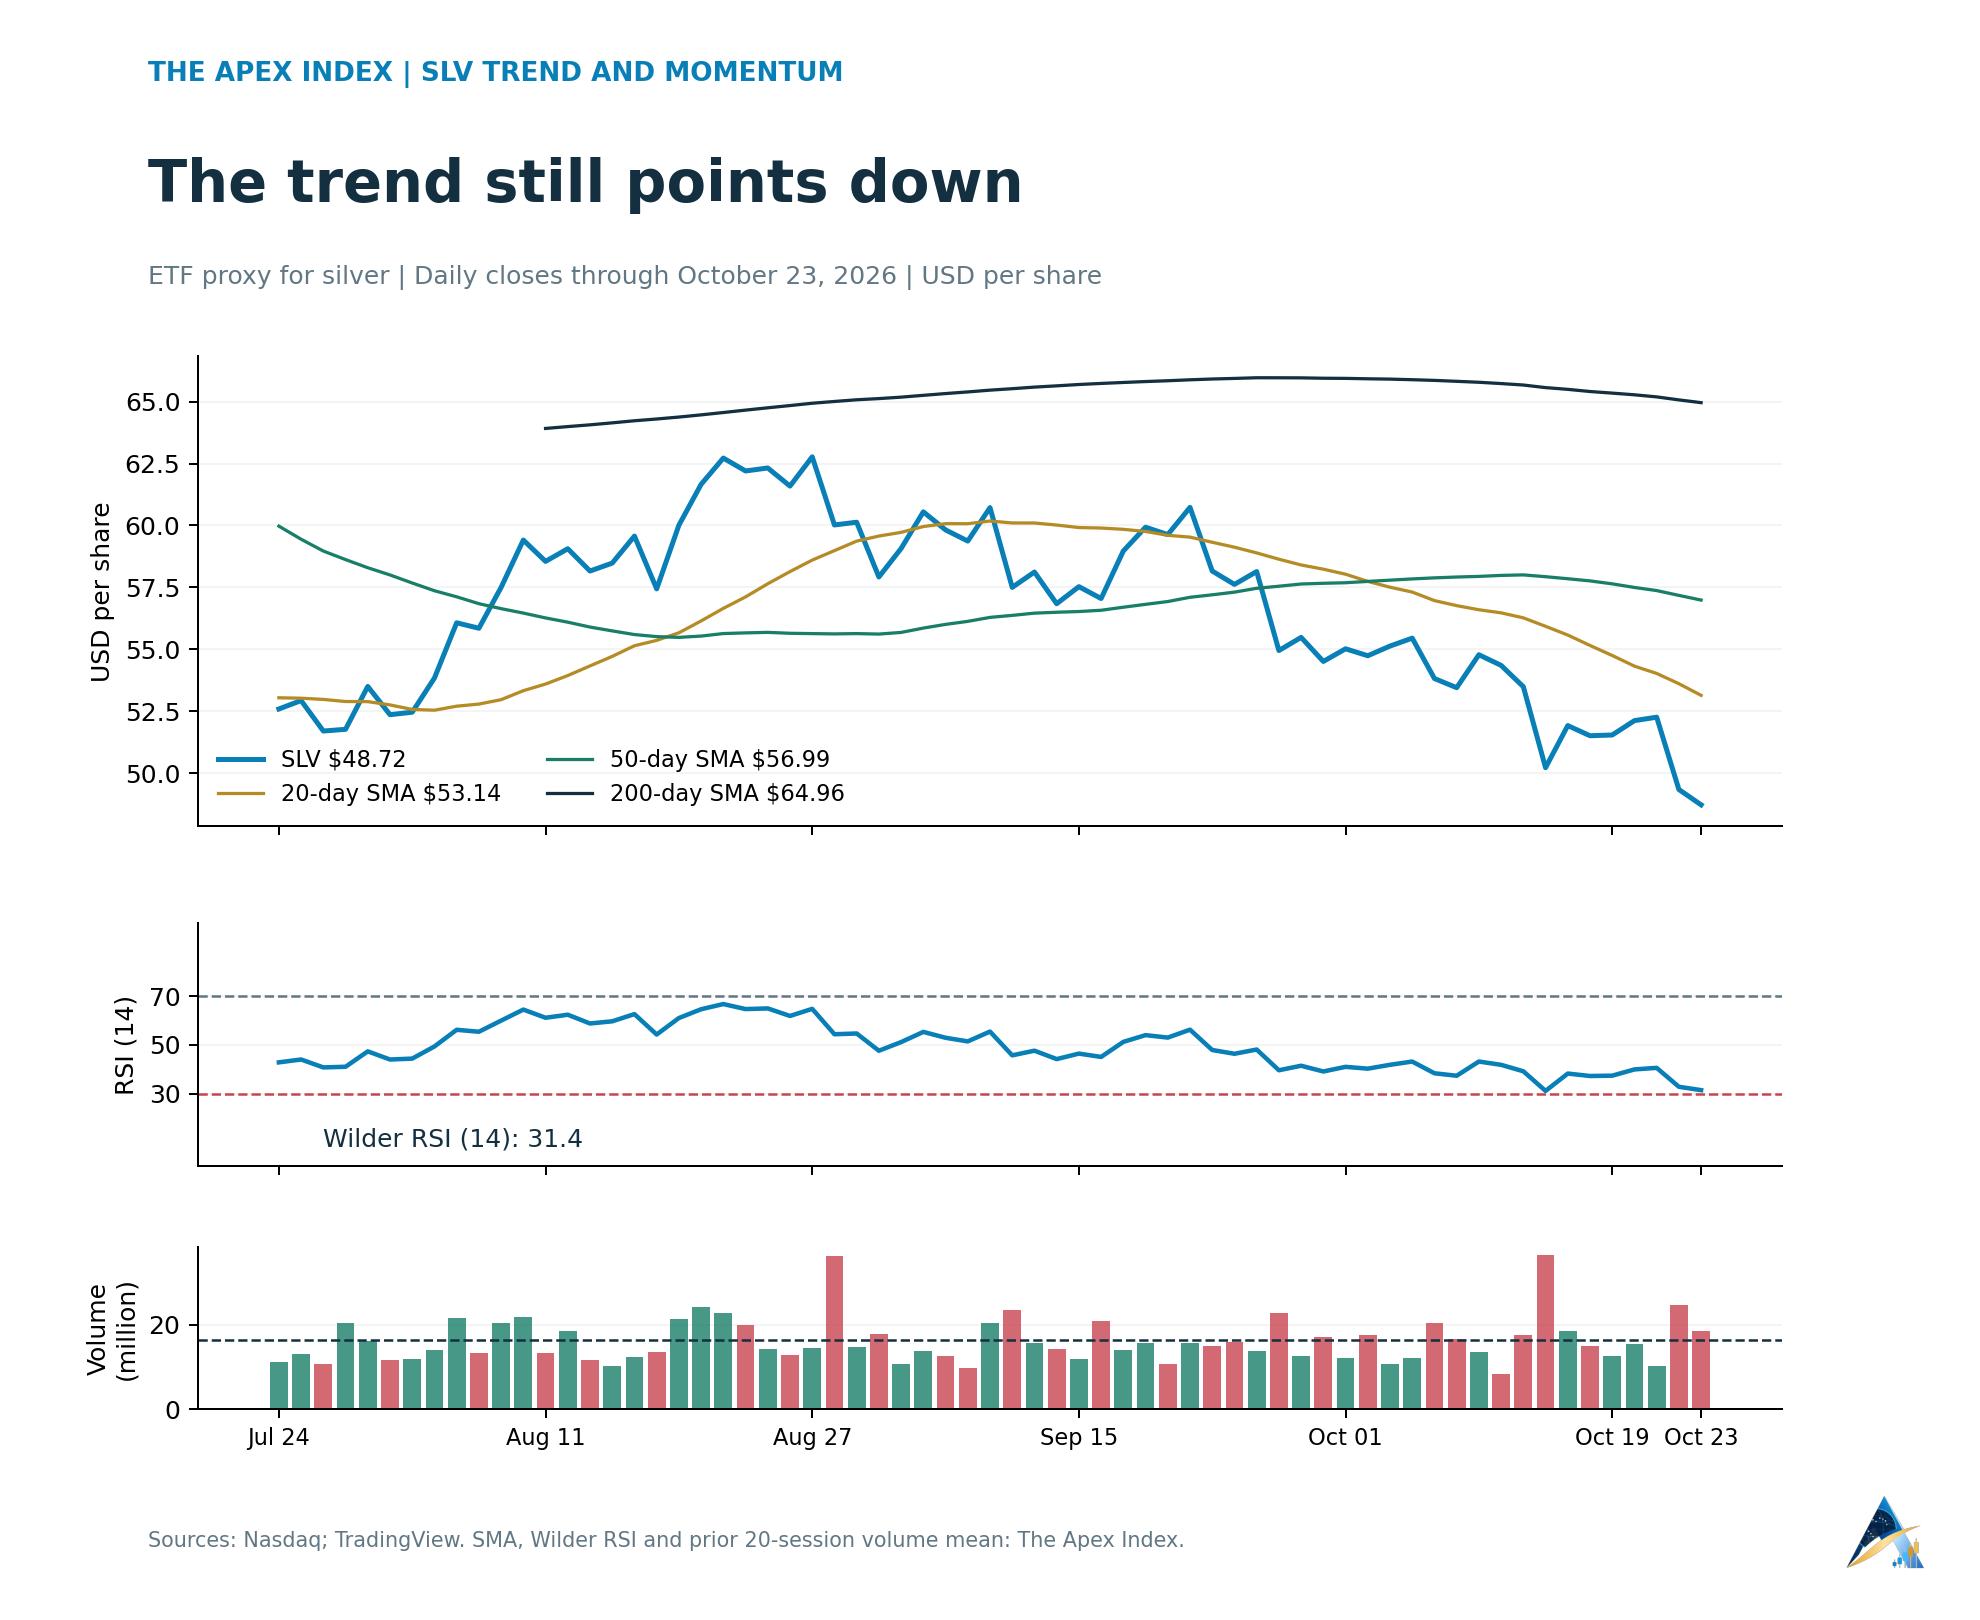
The 14-day Wilder relative strength index was 31.4, close to the conventional oversold threshold of 30. That leaves room for a relief rally after heavy selling. An oversold reading alone cannot identify the bottom, because momentum can stay weak while prices keep falling.
Friday's volume was about 18.47 million shares, roughly 1.13 times the preceding 20-session average. Turnover was above normal, but a single session offers too little evidence to call this a final washout.
The fund's $47.865 Friday low is the nearest downside reference. If it fails, $45 becomes a round-number checkpoint, followed by the $41.70 low recorded on October 27, 2025. On the upside, $48.98, Friday's high, comes first. The $49.20-$50.33 area covers Thursday's trading range and the broken $50 level. A recovery that holds above that zone would give buyers a better foothold before the 20-day average comes into view.
What would make the outlook improve?
A useful recovery would show up in the price before it required faith in a distant target. For spot silver, that starts with holding the latest low and recovering the $54.74-$55 area. For SLV, it means regaining the broken trading range, followed by a sustained move above the 20-day average. Further lows would invalidate an early bottom call.
Beyond the chart, watch the dollar, interest-rate expectations and whether physical investment absorbs metal as industrial users cut consumption. A cheaper price can attract buyers, but it can also tempt investors into adding to a losing position too quickly. Anyone buying in stages needs a limit on the total exposure and a plan for another decline. With silver this volatile, deciding that after the next sharp drop is an expensive way to find out how much risk feels comfortable.