
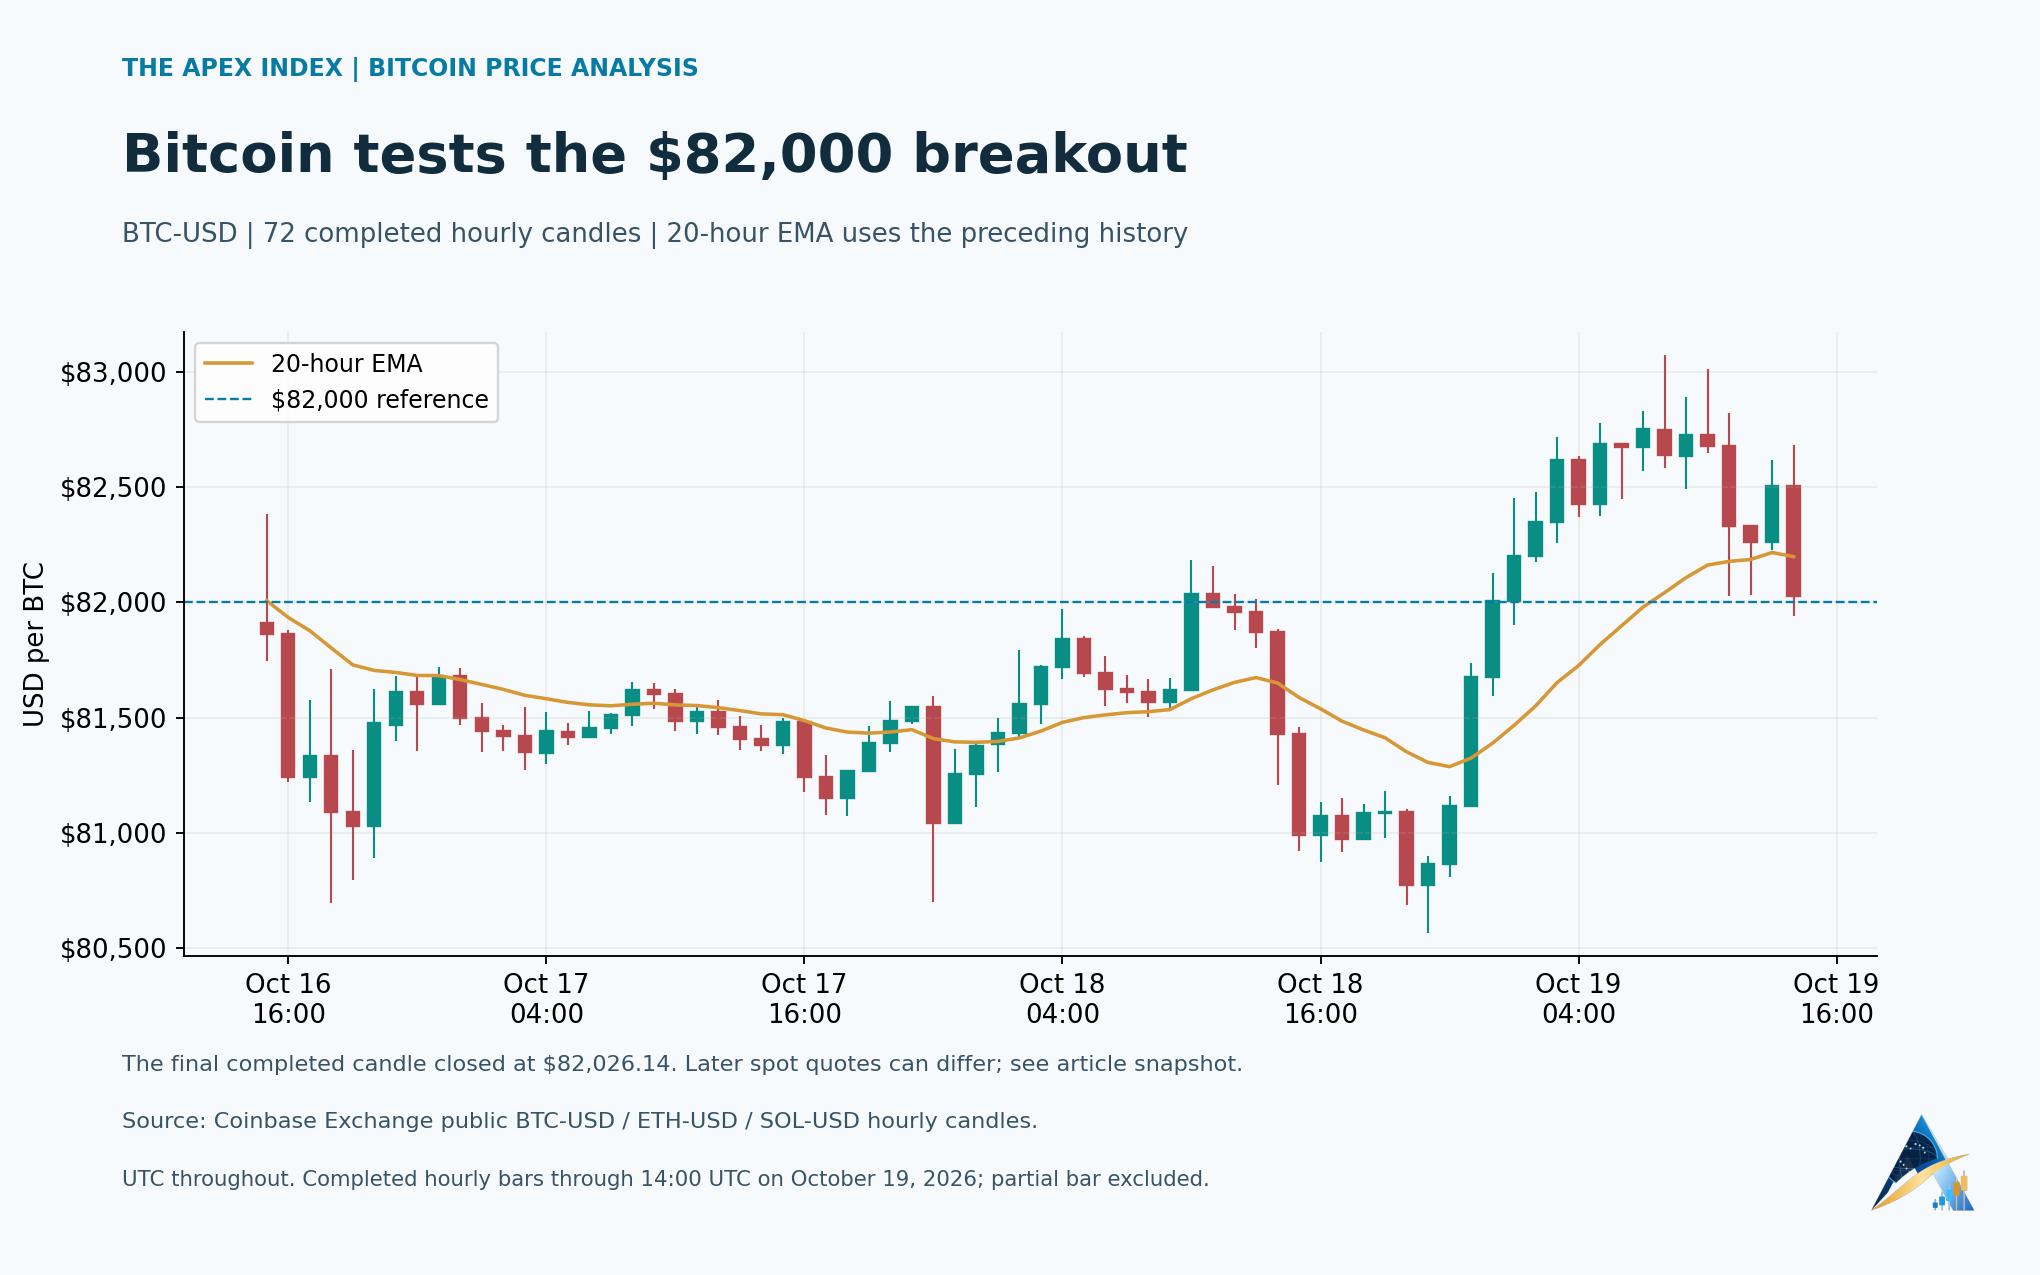
Bitcoin climbed back above $82,000 on October 19 and briefly traded above $83,000 as oil eased from a five-month high. The relief did not hold cleanly: by a 14:05 UTC price snapshot, Bitcoin had slipped back below $82,000, leaving buyers with a breakout to repair.
The broader picture is still better than another straight slide. CoinGecko's snapshot put Bitcoin around $81,855, up approximately 0.76% over 24 hours. But an intraday rally and a lasting recovery are different trades, and the hourly data now puts that distinction squarely in view.
Oil offered some relief, with supply risks still hanging around
Reuters reported Brent futures at $108.41 a barrel at 11:52 UTC, down $1.45, or 1.32%, after Friday's settlement reached the highest since May 19. WTI was also lower at $101.09.
Cheaper oil offers a less hostile backdrop for risk-taking by easing one source of inflation and interest-rate anxiety. Yet oil above $100 still leaves little room for complacency about energy costs. UBS analyst Giovanni Staunovo told Reuters:
Ongoing strikes on vessels crossing the Strait of Hormuz and flows remaining below pre-conflict levels continue to provide support.
As previously reported by Apex, Trump waived new Russian sanctions and tariffs ahead of the midterms. The policy has raised expectations of additional supplies, while shipping disruptions remain a separate constraint.
Priyanka Sachdeva, head of market insight at Phillip Nova, offered a sharper assessment to Reuters:
Trump's move looks like another desperate attempt to keep oil prices in check ahead of the US midterm elections.
That makes the oil pullback useful breathing space for Bitcoin, rather than a settled improvement in the economic backdrop.
The $82,000 breakout needs another push
The source data tells a more cautious story than the morning rally alone. Coinbase recorded a high of $83,076.23 and a low of $80,564.57 across the 24 completed hourly candles ending at 14:00 UTC.
The last of those candles closed at $82,026.14. Our 20-hour exponential moving average, calculated using the preceding seven days of hourly closes, stood near $82,199. The later CoinGecko snapshot below $82,000 shows the market giving back part of that advance after the completed chart window.
For buyers, the first job is to recover $82,000 and then get back above the moving average around $82,200. Sustaining that area would put the session high near $83,076 back in play. Another rejection would leave the rebound looking vulnerable to further retracement.
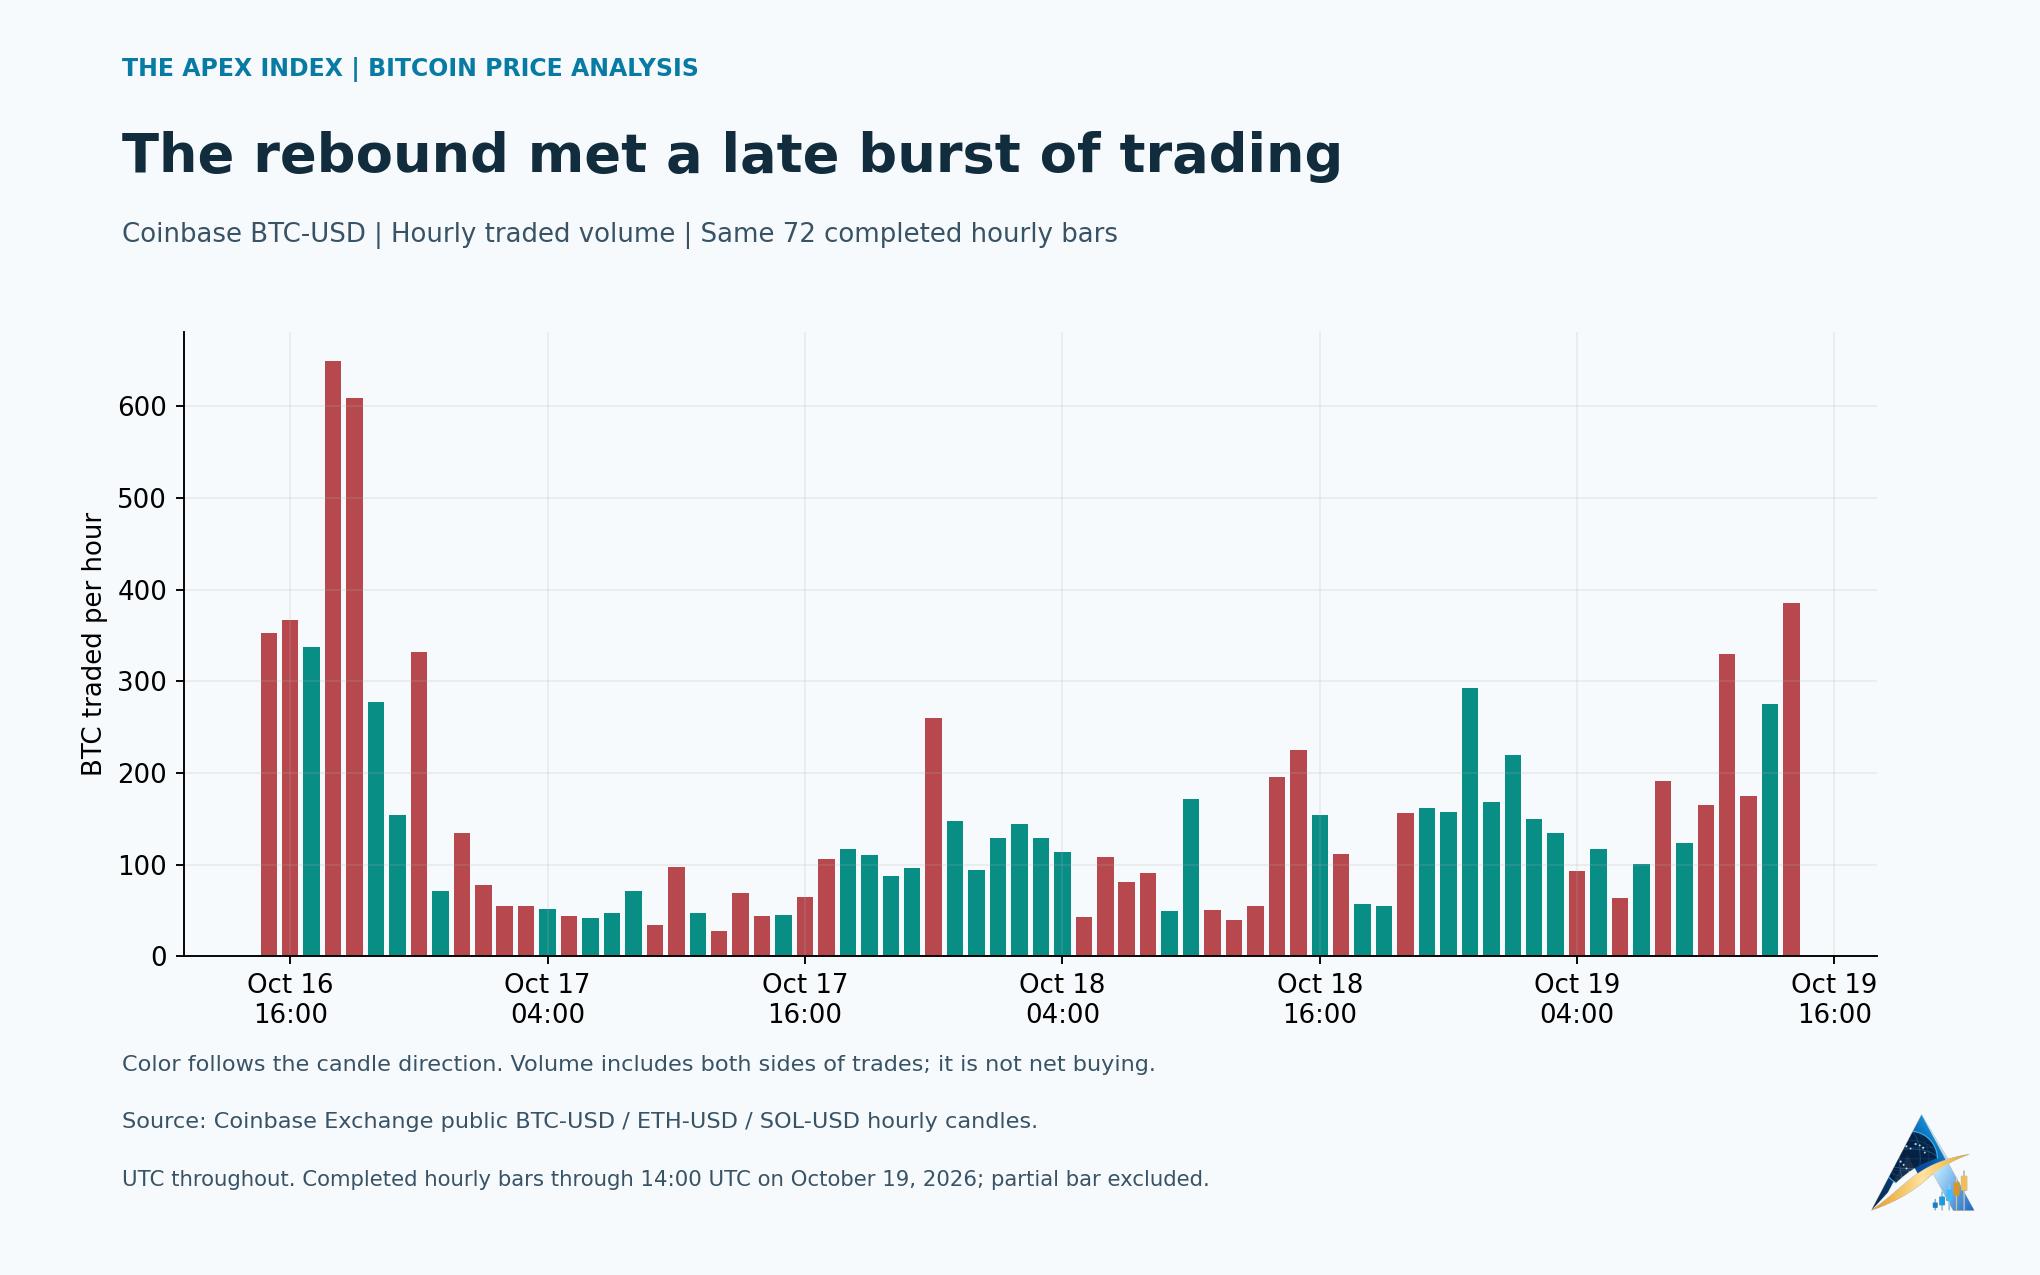
The volume chart adds a caution. Trading increased in the final completed down candle, which closed well below its opening price. That records heavier activity during the pullback; it does not identify who was buying or establish that sellers have exhausted their supply.
Momentum has cooled toward neutral
Wilder's 14-period RSI on the completed hourly candles ended near 48.6. The calculation uses a full week of hourly history to seed the indicator, with the still-forming candle excluded.
That reading is close to the midpoint, below the conventional 70 overbought threshold and above the 30 oversold threshold. Momentum has cooled as price has retreated from its intraday peak. It is not showing a clear upside impulse at the last completed observation.
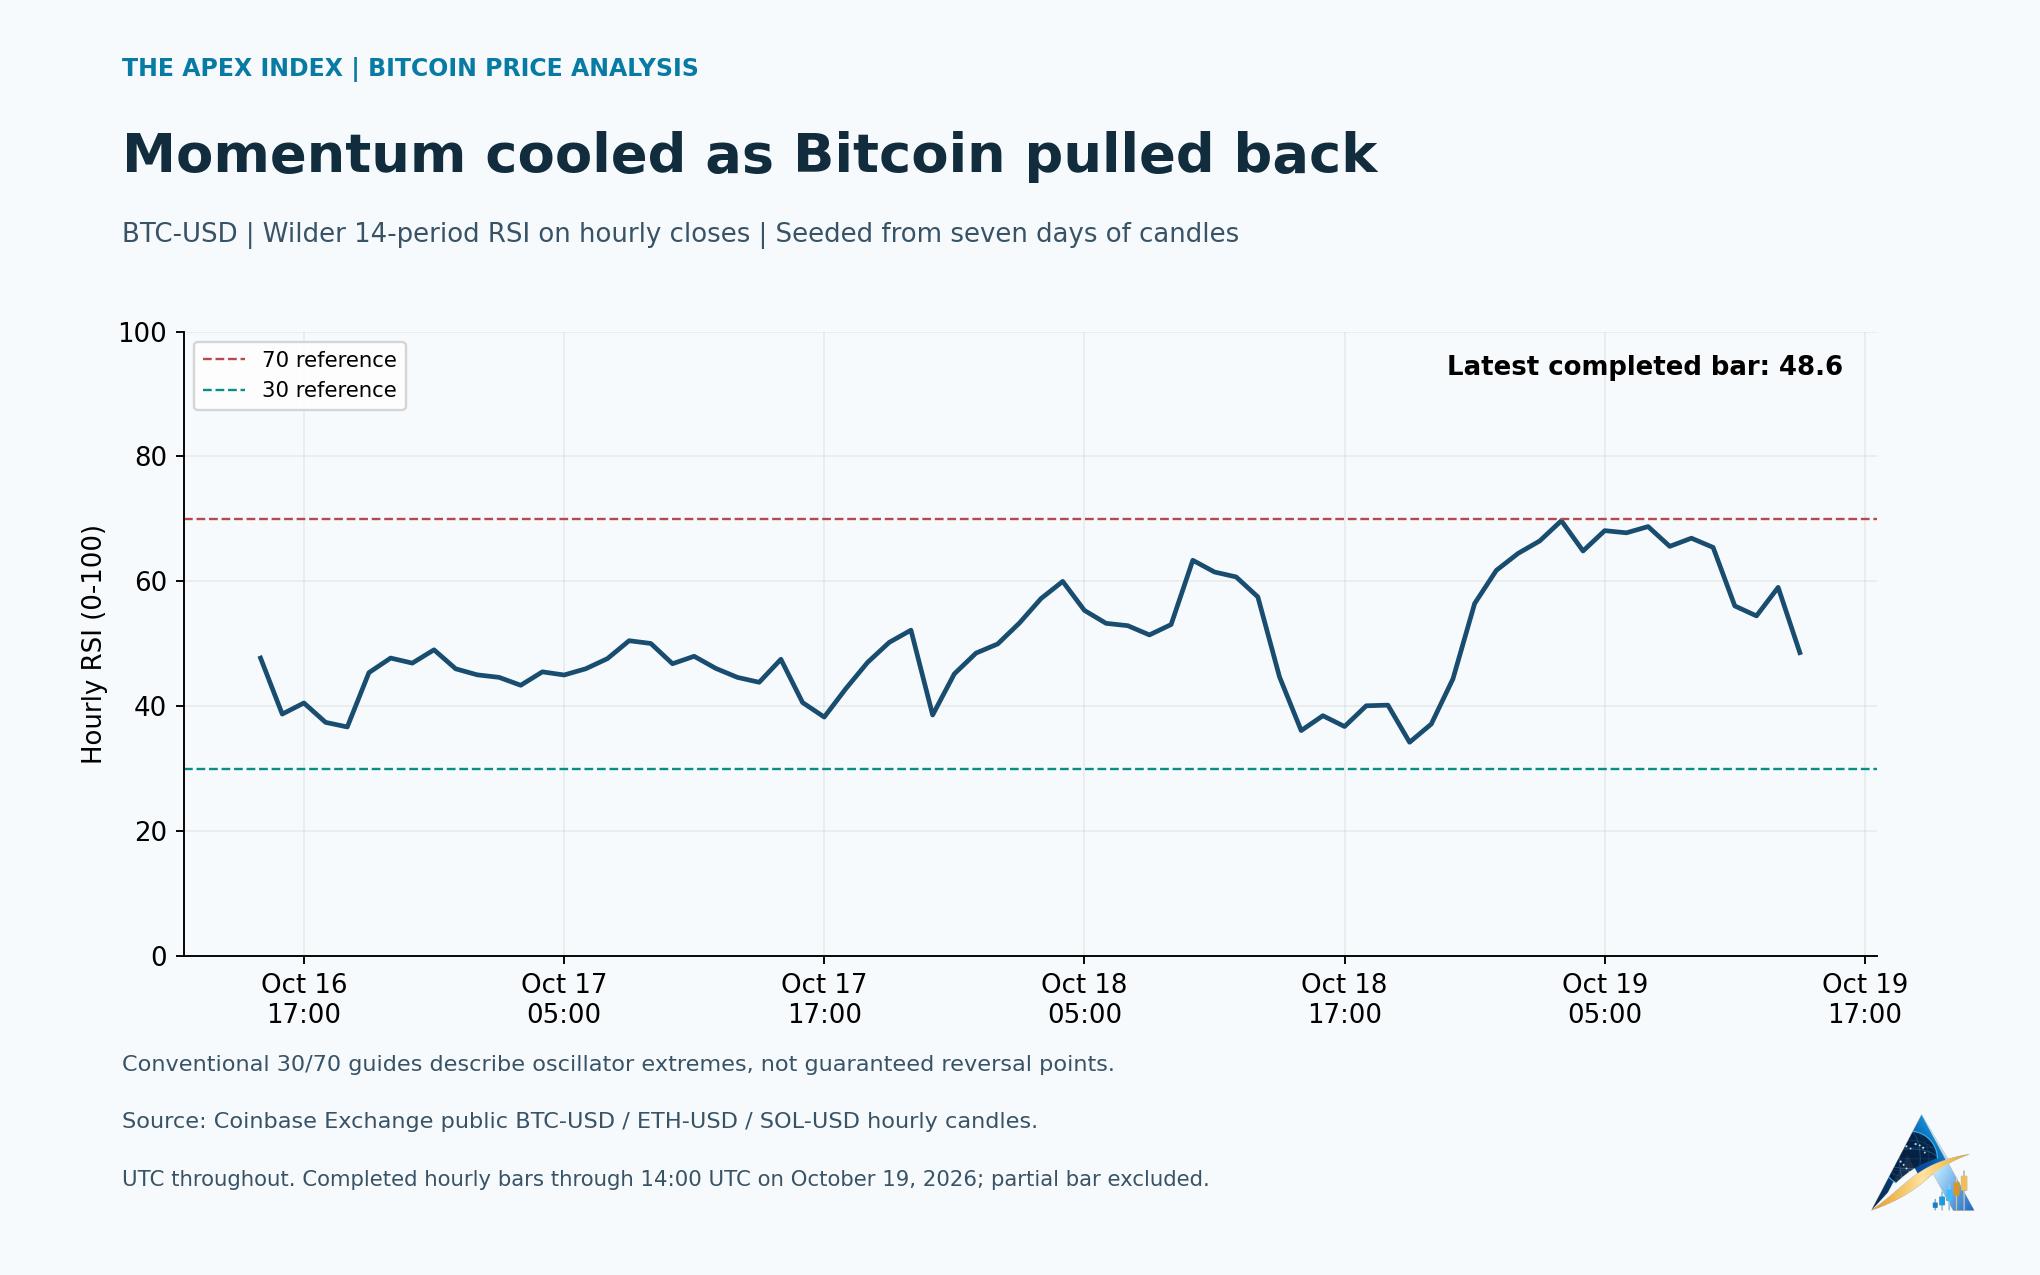
A recovery in price accompanied by a firmer RSI would improve the short-term picture. Price pushing higher while the oscillator stalls would warrant more caution. Neither observation, by itself, determines the next move.
The crypto recovery is uneven
A matched 48-hour comparison on Coinbase puts Bitcoin ahead of the other two large tokens in our chart. Across identical completed observations, Bitcoin gained about 0.79%, Solana added 0.32%, and Ether fell 0.91%.
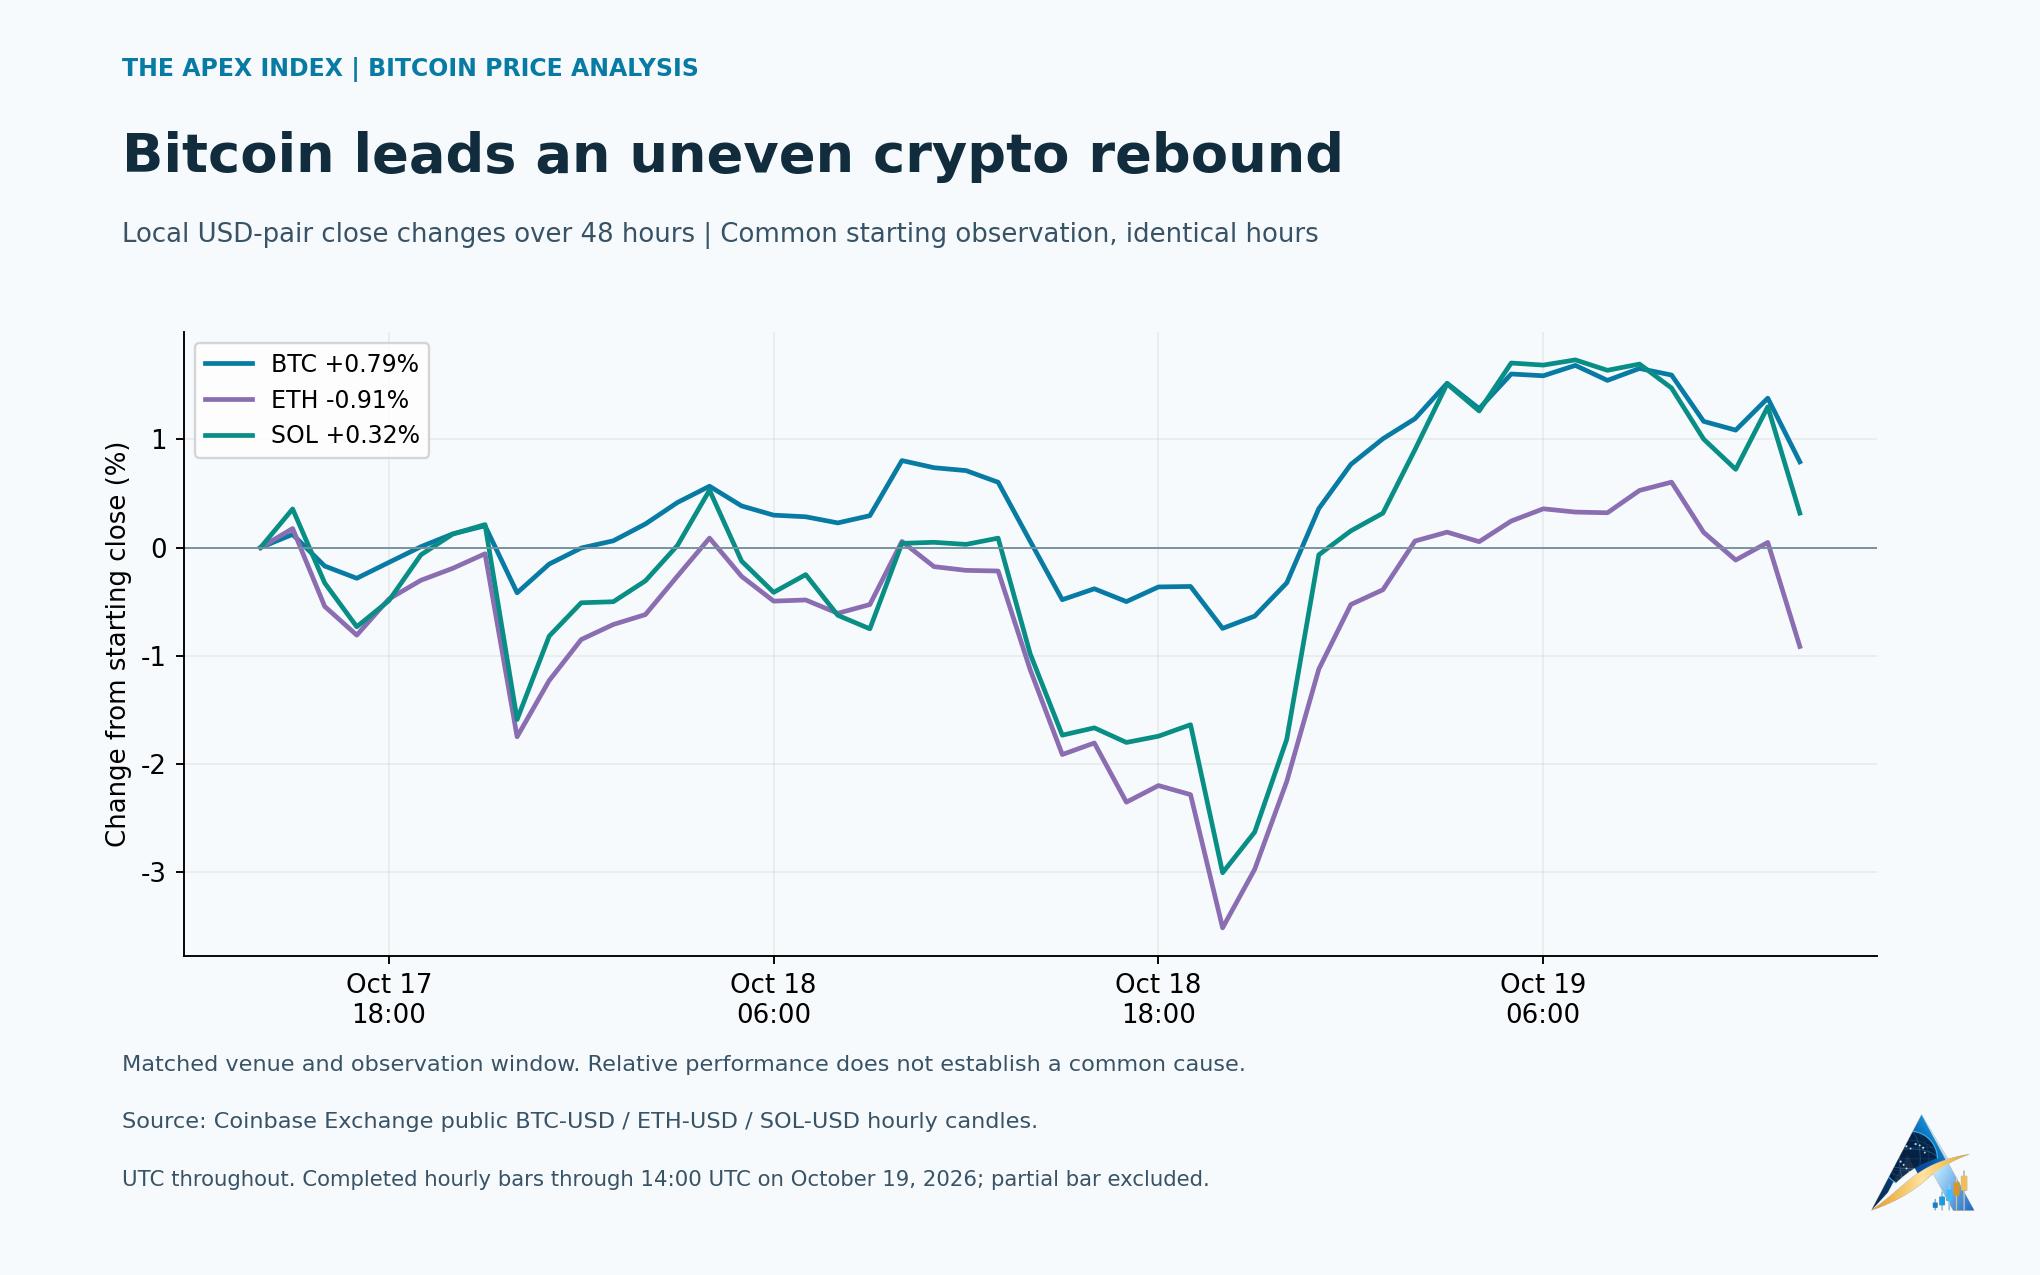
Those are 48-hour, single-venue returns, separate from CoinGecko's aggregate 24-hour change. The comparison shows why a Bitcoin bounce should not automatically be read as a broad recovery across crypto.
As Apex previously reported, the day's stock-market moves were also uneven, with sharp Indonesian losses alongside gains in South Korea and Shanghai. Risk appetite is recovering selectively.
The levels that would change the picture
The constructive scenario starts with Bitcoin reclaiming $82,000-$82,200 and holding it through completed hourly closes. A move beyond $83,076 would then clear the observed session high. That would improve the case for further recovery, without providing a verified target above the market.
On the downside, $80,565 is the observed low of the completed 24-hour sample. A sustained break below it would weaken the rebound setup and bring the round $80,000 area into focus. That round number is a psychological reference, not a guaranteed floor.
The rally bought Bitcoin some room. Buyers now need to keep it, while oil and the wider market decide whether the relief lasts.