

ETH has a plausible recovery route toward $3,000–$3,257 before the end of 2026, but the chart has not earned that forecast yet. The immediate problem is reclaiming the $2,554–$2,617 trend band, followed by $2,679 and the September ceiling at $2,807. Until those levels become support, Ethereum’s latest bounce is a recovery attempt inside a damaged short-term trend.
The bearish alternative is equally concrete. A sustained loss of $2,357 would expose support around $2,295, $2,231 and $2,130 before a range projection near $1,907. Between $2,357 and $2,807, the central case is an unresolved trading range. The projections describe conditional price tests during the rest of 2026, rather than a promise about the December 31 closing price.
The snapshot and the method
The reference price is $2,507.36, recorded on October 10 at 15:57 UTC. CoinGecko’s contemporaneous aggregate quote was $2,508.14, providing a useful cross-exchange check without pretending every venue trades at an identical price. Percentages attached to the scenario targets use the first figure consistently; the charts use completed daily closes.
The Apex Index calculated the indicators from 404 completed daily candles in the exchange history. The final included session is October 9, which closed at $2,485.23. October 10 is excluded because its candle is still developing. A live quote above that close can improve the intraday picture while leaving the completed-bar momentum readings unchanged.
The calculations use a 20-day exponential moving average, 50-day and 200-day simple averages, Wilder-smoothed 14-day RSI and average true range, and 12/26/9 MACD. EMA calculations use a first-close seed with the full history as warm-up. Bollinger bands use a 20-day mean and two population standard deviations. Each chart input was checked twice, with indicator arithmetic independently recalculated.
That separation matters here. TradingView’s updating daily readings already reflect Saturday’s rebound, whereas the accompanying charts stop at Friday’s close. Mixing the live RSI with a completed-bar MACD would create a technical picture that never existed at one moment. This analysis uses the closed-bar set for its trend conclusions and the dated spot quote for target distances.
The short-term trend has broken, but the larger recovery survives
The completed-bar 20-day EMA is approximately $2,617 and the 50-day SMA $2,554. Price below both means recent buyers are, on average, under pressure. A bounce into those levels can encounter selling from traders using the recovery to reduce exposure. Reclaiming the averages would change that immediate structure; merely touching them would not.
The 200-day SMA is much lower, around $2,130. ETH therefore remains above its longer-term trend reference despite the recent decline. This is a mixed hierarchy: short-term weakness inside a broader recovery, rather than a clean alignment of every moving average in one direction. A bearish daily chart does not automatically establish a new multi-month bear market.
The September range supplies more useful boundaries than a round-number target alone. Its low was $2,356.82 on September 15, and its high $2,807.10 on September 21. The $450.28 width is large enough to matter. Current price is approximately 6.0% above the floor and 12.0% below the ceiling, leaving more overhead repair work than immediate room to that support.
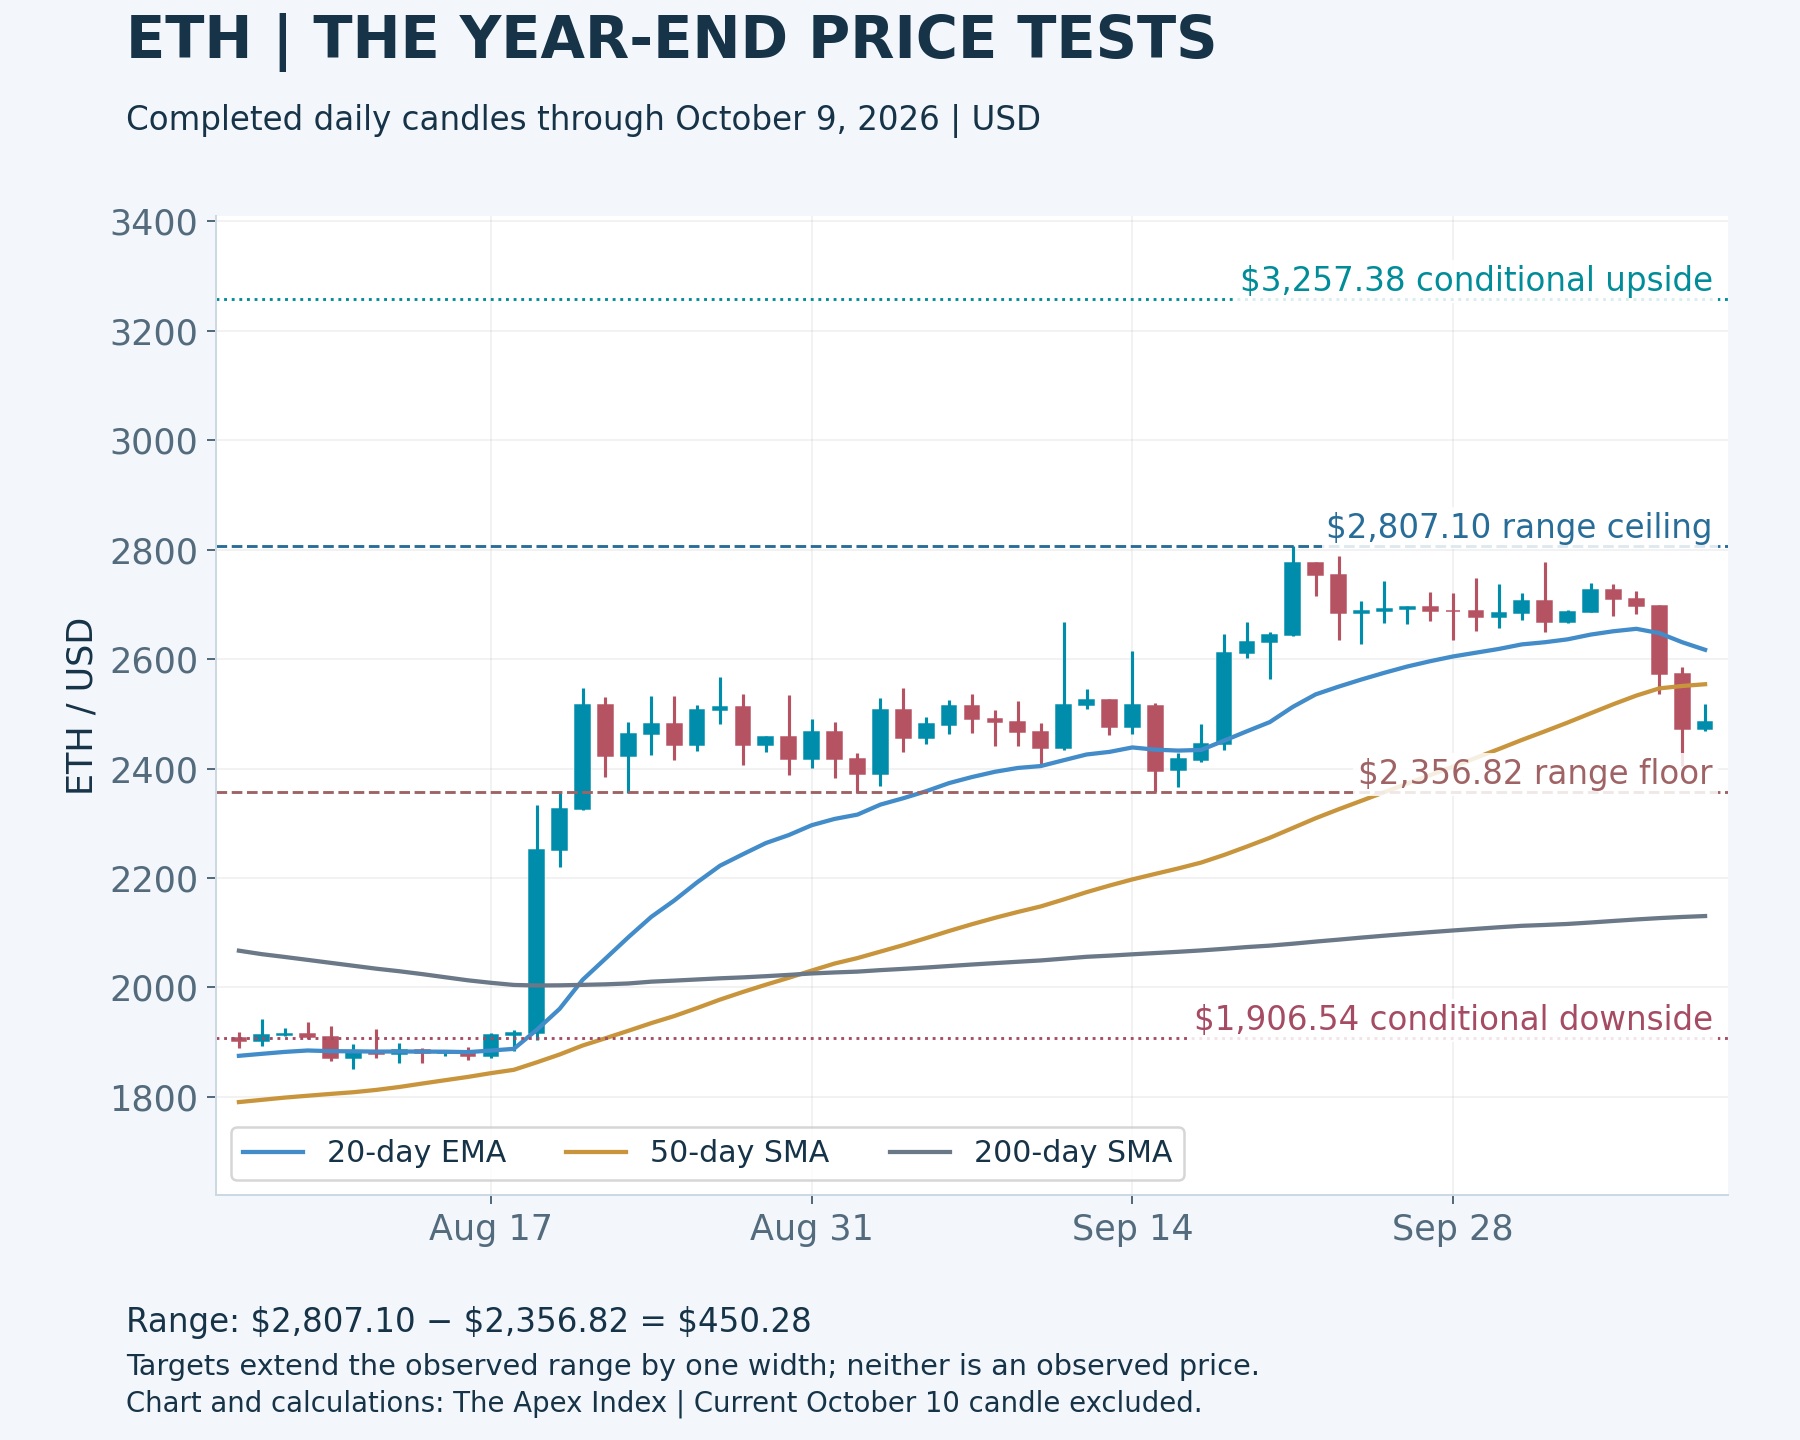
The newest completed candles also show where the selling intensified. ETH fell from an October 2 close of $2,668.13 to $2,485.23 on October 9, a 6.85% decline across those closing observations. The October 8 low at $2,404.60 is now an intermediate support test, above the September floor. Losing it would weaken the bounce without yet activating the full range-breakdown scenario.
Friday’s close remained below the lower Bollinger band, approximately $2,521. That indicates a stretched downside move relative to the recent distribution of closes. It can precede a rebound, but it is not a buy signal on its own. In a persistent decline, prices can stay outside the lower band while the average and the band themselves move downward.
Momentum needs more than one green session
The completed-bar RSI is approximately 38.9. It is below the neutral 50 threshold but above the conventional 30 oversold boundary. The distinction rules out two lazy readings: momentum is not healthy simply because price bounced, and the indicator does not establish an extreme oversold condition that must immediately reverse.
MACD remains positive at approximately 13.05, but its signal line is much higher at 49.06. The resulting histogram is about negative 36.02. That combination captures a recent loss of acceleration while some longer-window recovery momentum remains in the calculation. A histogram becoming less negative would be an early improvement, not confirmation that the range ceiling has broken.
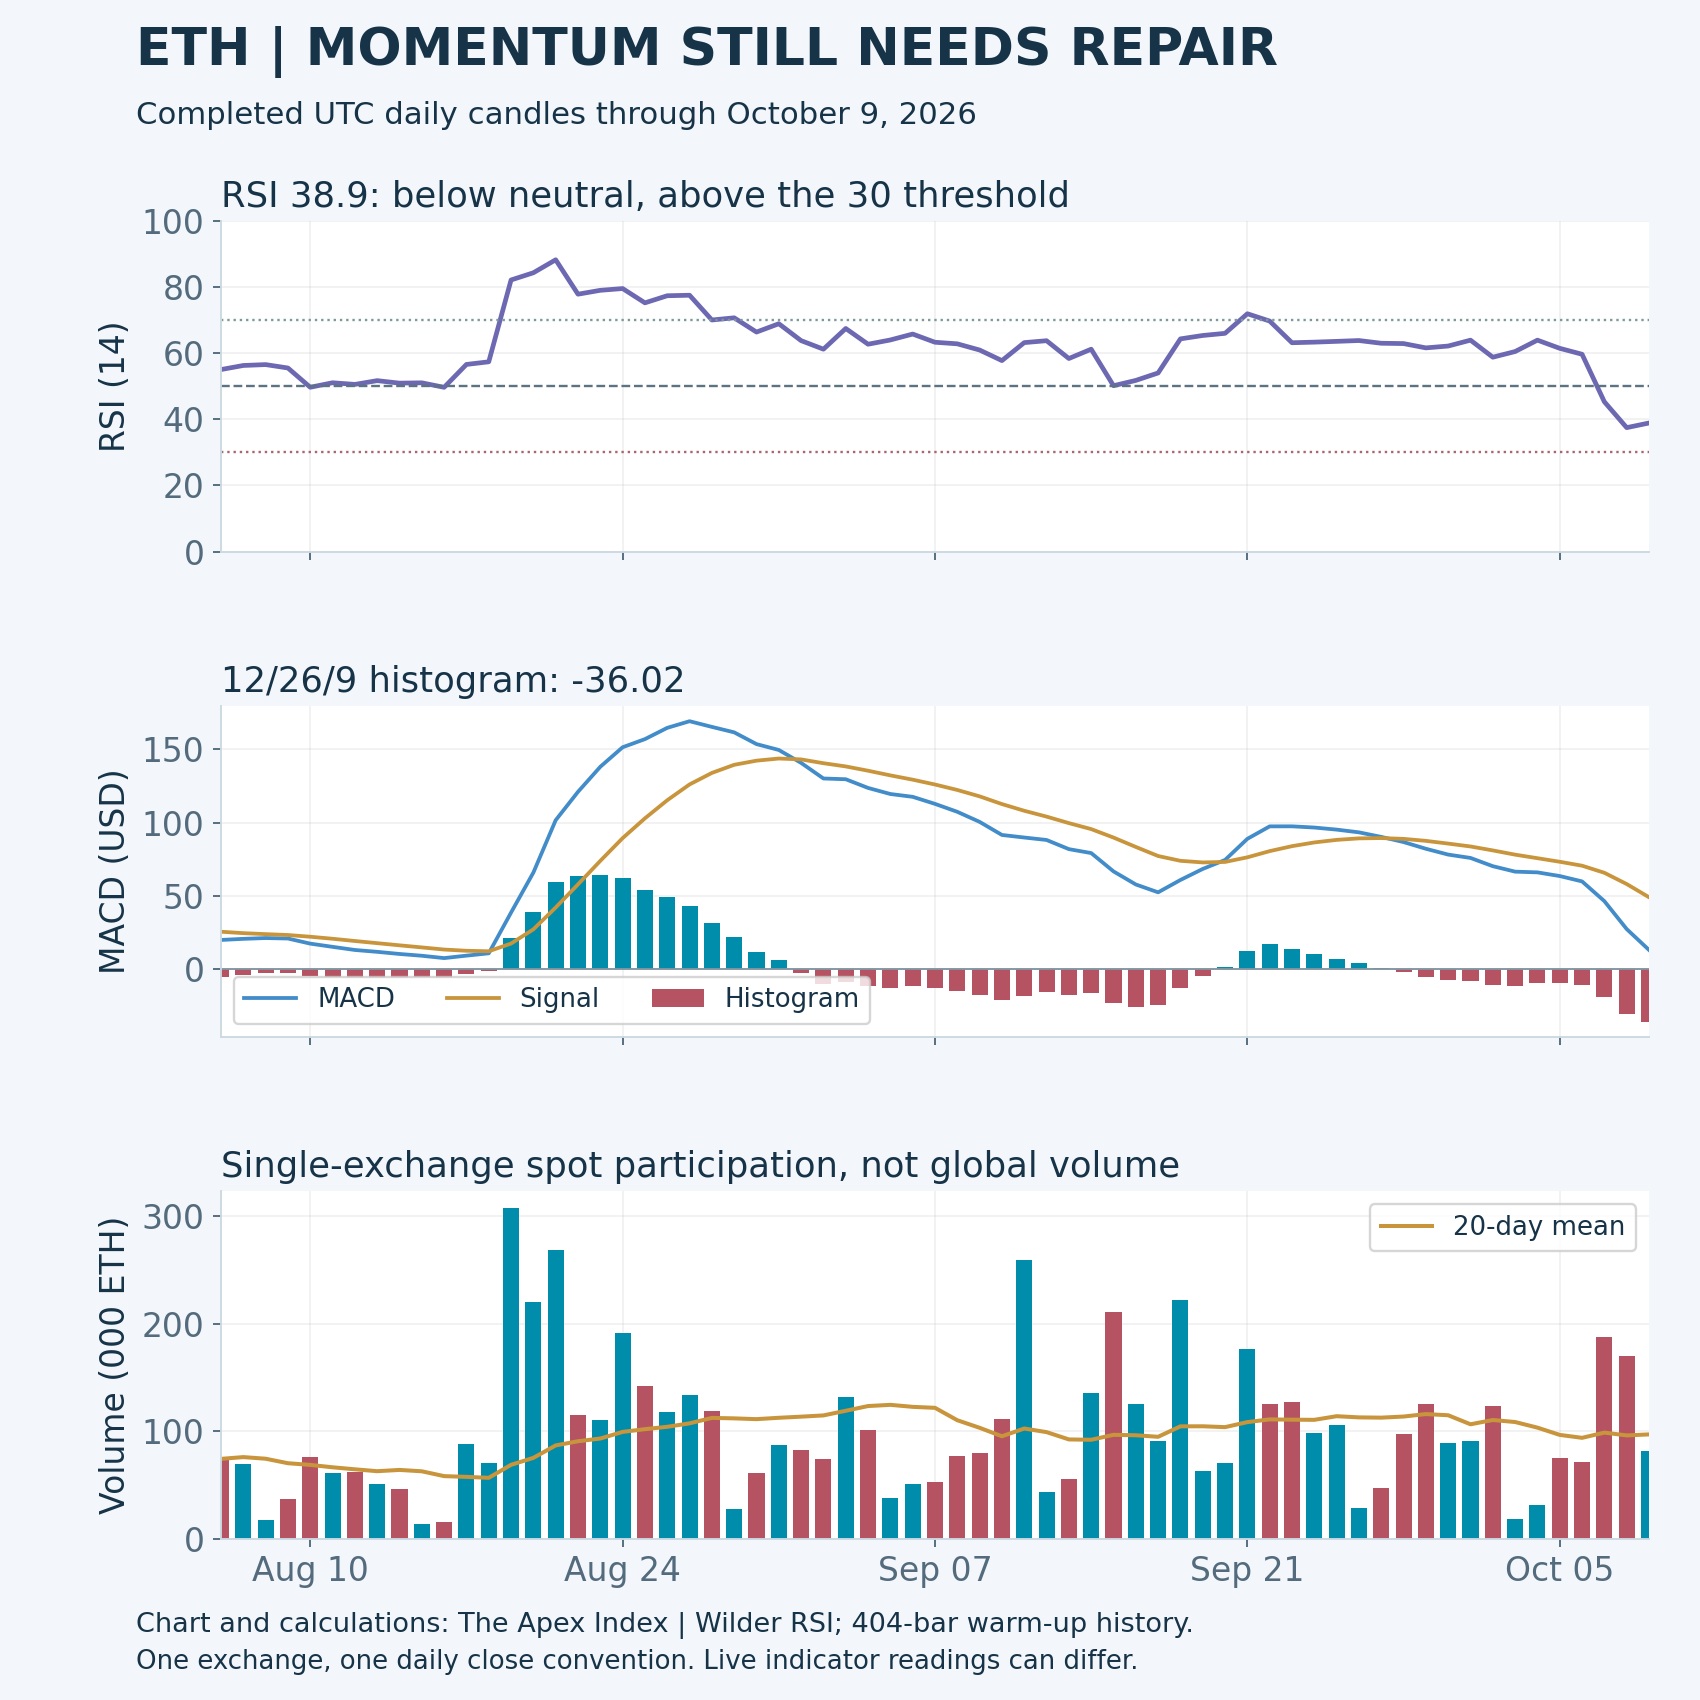
For a convincing repair, RSI should regain 50 while the MACD histogram contracts toward zero and price closes above the short-term trend band. The sequence matters more than checking one indicator in isolation. A brief RSI improvement below $2,554 would be consistent with an ordinary rebound into resistance, while a sustained reclaim above $2,617 would carry more weight.
Participation is another test. The latest 20-day mean on the chart’s exchange is approximately 96,855 ETH per session; October 9 traded about 81,645 ETH. October 7 and 8 recorded roughly 187,738 and 169,570 ETH respectively. Selling sessions drew substantially more activity than Friday’s recovery, so the bounce has not yet matched the preceding decline’s participation on that venue.
This is exchange-specific spot volume, not an estimate of all Ethereum trading worldwide. A stronger recovery would ideally bring repeated above-average participation on completed up days, rather than relying on a thin weekend print. Weekend turnover should be assessed against comparable sessions, however, rather than dismissed automatically because it is lower than weekday activity.
ETF demand is still moving the wrong way
The latest completed U.S. ETF session is October 9. Farside Investors’ table records $56.1 million of net outflows that day, following $72.5 million on October 8 and $160.9 million on October 7. The five sessions from October 5 through 9 total $542.2 million in withdrawals. Saturday’s absence of a new U.S. session is not a zero-flow observation.
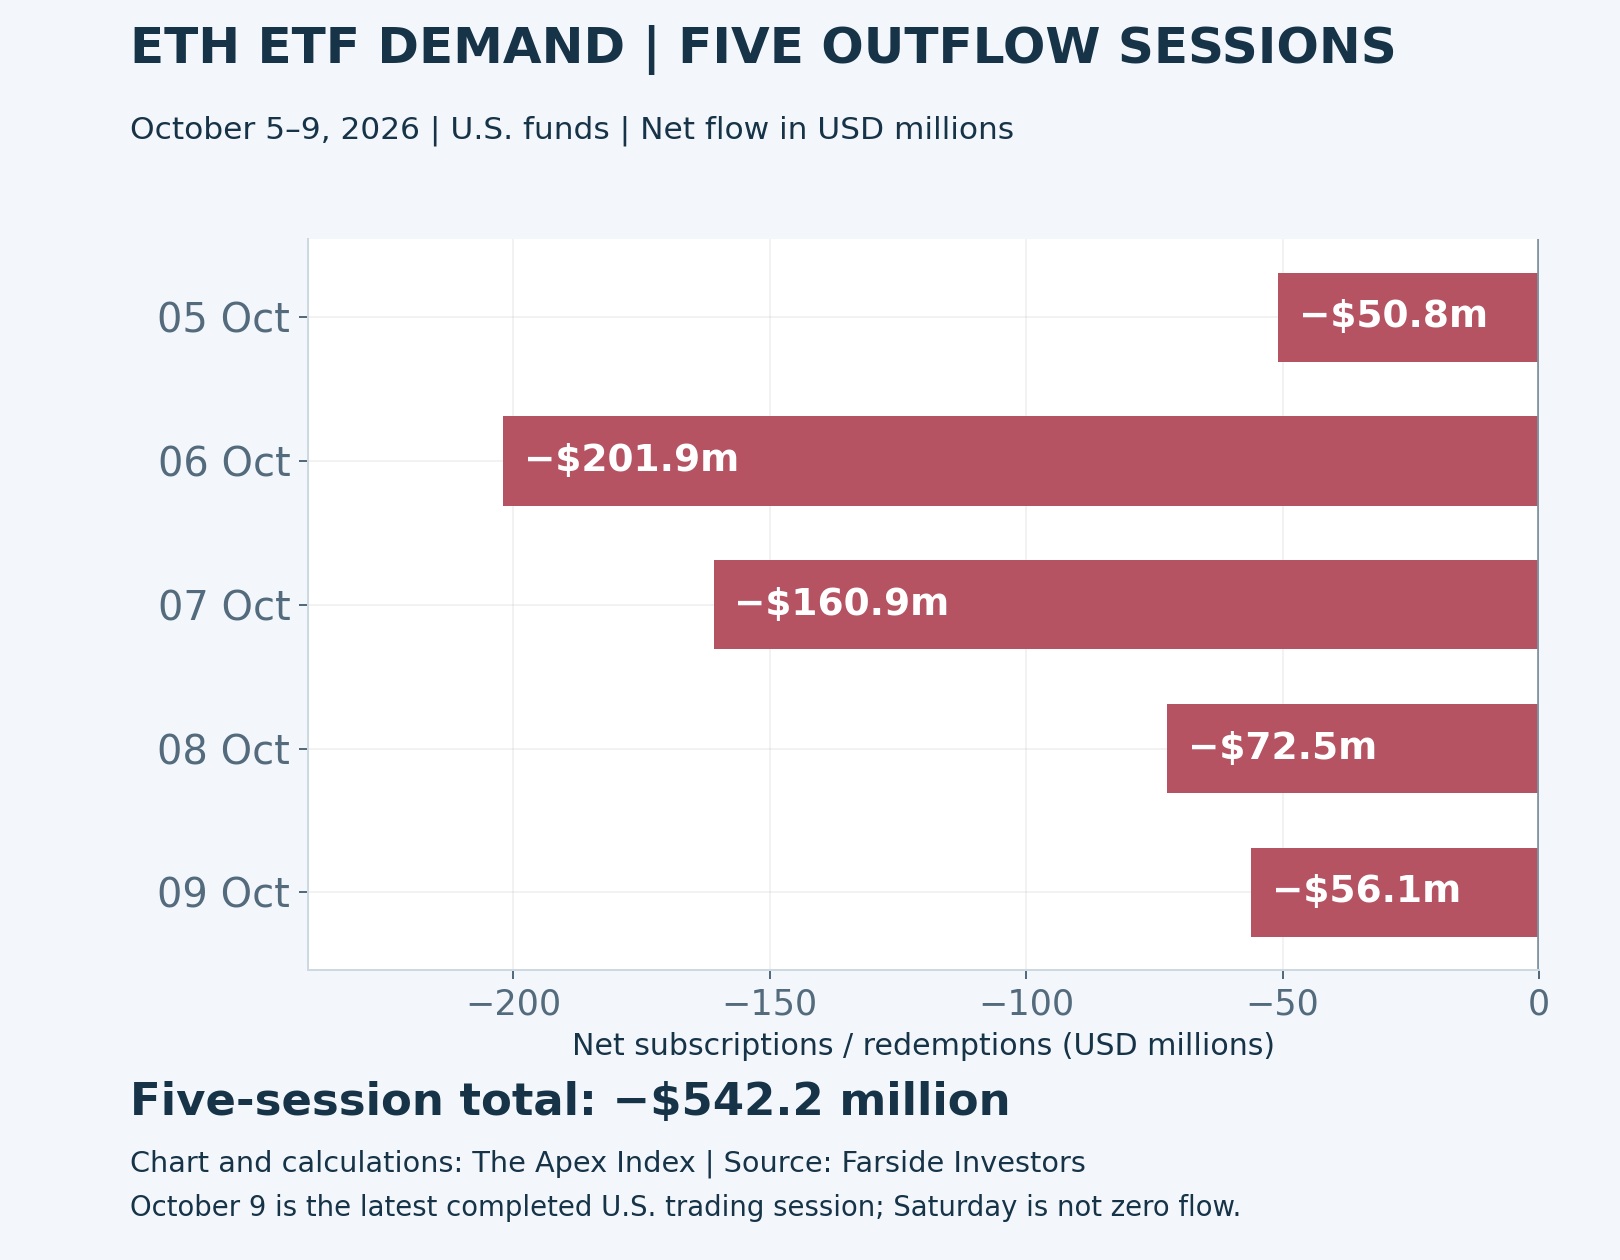
The broader sequence is nine consecutive negative sessions from September 29, totalling $697.4 million. October’s seven completed sessions account for $635.0 million of that sum. These figures measure net subscriptions and redemptions across the table’s U.S. funds, not exchange trading volume, total assets or the amount of ETH liquidated by leveraged traders.
The pace eased toward the end of the week. October 6’s $201.9 million withdrawal was much larger than Friday’s $56.1 million, which is worth monitoring. But smaller redemptions remain redemptions. A durable bullish interpretation would be stronger after several positive sessions, especially if that change coincided with price reclaiming the resistance band rather than occurring after another failed breakout.
ETF flows cannot explain every move in a market that trades continuously and globally. They do establish that one visible institutional demand channel was withdrawing capital during the recent decline. Assigning the whole selloff to those withdrawals would overstate the evidence; ignoring them while projecting a straight-line recovery would understate a relevant headwind.
Derivatives can amplify the next move without predicting its direction
CoinGlass’s October 10 snapshot put tracked ETH futures open interest at approximately $31.76 billion. Its 24-hour futures turnover was about $13.39 billion, against $885.5 million of tracked spot turnover. Within that provider’s coverage, futures turnover was roughly 15.1 times spot turnover. The comparison points to a market where leveraged activity can strongly influence short-term price discovery.
It does not mean traders are 15 times more bullish, or that $31.76 billion of fresh money entered ETH. Open interest is outstanding contract exposure; turnover counts trading during a window. Every contract has counterparties. Dollar-denominated open interest can also change as the underlying price changes, even without an equivalent change in the number of contracts.
Tracked ETH liquidations were approximately $7.26 million over the same rolling 24-hour snapshot. Without a verified long-versus-short split or a time-matched historical comparison, that number cannot establish which side is now crowded. Nor does it identify a liquidation wall at a particular chart level. Support and resistance here come from spot price history, not an invented heatmap.
OKX’s October 10 funding snapshot at 15:58 UTC estimated roughly negative 0.00023% for the approaching settlement, while the previous settled rate was slightly positive. That is a venue-specific, provisional reading, not a market-wide funding index. It offers little support for confidently declaring either a crowded long trade or a large short squeeze already under way.
The useful confirmation comes from combinations. Rising price with improving spot participation and measured growth in open interest would fit new demand. A bounce driven by shrinking open interest could instead be short covering. Falling price alongside expanding open interest would require closer scrutiny of funding and positioning before treating the decline as exhausted.
ETH also needs to stop losing ground against Bitcoin
The synchronized daily closes produce an ETH/BTC ratio of approximately 0.03011 on October 9, down from 0.03157 on October 2. That is a 4.64% relative decline across the same dates. ETH’s weakness therefore extends beyond a falling dollar price: it also lost purchasing power against Bitcoin during the latest completed week.
As previously reported by Apex, Bitcoin’s October 8 selloff coincided with ETF withdrawals and derivatives liquidations. That provides relevant market context, but does not make the two assets’ support levels interchangeable. ETH’s greater relative weakness needs its own explanation and its own confirmation before a recovery target becomes actionable.
A dollar rebound with a still-declining ETH/BTC ratio would leave the asset lagging the market leader. Relative stabilization would strengthen the case for a broader recovery in ETH demand. There is no requirement that the ratio return to its October 2 reading in one move; a sequence of higher daily ratio lows would be more informative than a single sharp spike.
Uptober is an established seasonal shorthand in crypto markets, but it cannot override this divergence. A favorable calendar reputation does not replenish ETF demand, repair a broken moving-average structure or reverse relative weakness. The year-end thesis rests on those observable changes, rather than borrowing Bitcoin’s seasonal record as an automatic forecast for Ethereum.
The bullish path: repair first, then expand the range
The first bullish milestone is acceptance above $2,554–$2,617. Next comes approximately $2,679, the 61.8% recovery level between the June 6 low of $1,505 and January 14 high of $3,405.03. That area also overlaps several late-September and early-October closes. It is a plausible supply zone before the $2,807 range ceiling.
A completed daily breakout above $2,807.10, followed by a retest that holds and preferably a weekly close above it, activates the more ambitious scenario. The first major reference is around $2,998, the 78.6% recovery level of the same annual high-low structure. Treating $3,000 as a test makes more sense than assuming the round number will be crossed without resistance.
The range projection then adds the $450.28 width to $2,807.10, producing $3,257.38. That is approximately 29.9% above the dated reference price. It is a price-based measured move, not a statistical year-end confidence interval. The Fibonacci and range calculations share historical price inputs, so their agreement cannot be counted as independent proof that a target will be reached.
January’s $3,405.03 high is a further recovery reference if ETH accepts the $3,250 area and participation remains strong. It is outside the central upside zone. A failed breakout that closes back beneath $2,807 weakens the expansion thesis; losing $2,679 and then the reclaimed trend band would provide stronger evidence that the attempted reversal has stalled.
The bearish path: the floor must fail before the deeper target activates
Below the October 8 low near $2,405, the decisive test is $2,356.82. A wick beneath that level followed by a strong close back inside the range would differ materially from repeated closes below it. The bearish projection requires acceptance underneath the floor and a failed reclaim, not simply a volatile intraday excursion.
The last completed weekly 20-period EMA, measured through October 4, is approximately $2,295. Its age matters: the current week has not closed, so that value is a dated support reference rather than a final reading of the selloff week. The next annual retracement is approximately $2,231, followed by the completed daily 200-day average around $2,130.
Those intermediate levels could interrupt a decline before the full projection. Subtracting the range width from $2,356.82 gives $1,906.54, approximately 24.0% below the reference price. This is the central range-breakdown target, conditional on the floor failing. June’s $1,505 low becomes a deeper stress reference only if subsequent support also fails; it is not the base forecast.
Conversely, a breakdown that quickly recovers $2,357 and then holds above the $2,455 annual midpoint would weaken the bearish thesis. A sustained recovery of $2,554–$2,617 would require reassessing it more substantially. Invalidation follows price behavior and the timeframe of the setup, rather than changing a target simply because the latest candle looks uncomfortable.
What would make the forecast worth following?
The 14-day ATR is approximately $90.16, or 3.60% of the reference price. That is large relative to some of the gaps between nearby levels. A tight stop placed just a few dollars outside a line can be triggered by ordinary range variation. ATR describes recent realized movement; it is not a probability distribution, a guaranteed daily range or a valid multiplier for projecting December’s price.
The upside and downside percentages also have different starting conditions. The roughly 30% upside is measured from today’s snapshot, but the stronger bullish confirmation only arrives above $2,807. An entry after confirmation would have less remaining distance to $3,257. Likewise, waiting for a floor breakdown changes the remaining downside and the location of a sensible invalidation reference.
For the next sessions, the priority is whether price can repair the trend band, whether spot participation improves, and whether ETF redemptions give way to sustained demand. Funding and open interest then help distinguish new positioning from covering or forced exits. For the year-end horizon, weekly acceptance of the range boundaries carries more weight than a brief move through them.
The present evidence favors an unfinished recovery attempt, not an already confirmed bullish expansion. ETH above $2,357 retains room to stabilize; acceptance above $2,807 would materially improve the $3,000–$3,257 case. A sustained floor failure instead brings the $2,295–$2,130 support sequence and $1,907 projection into focus. Those are the conditions the next price moves must resolve.