
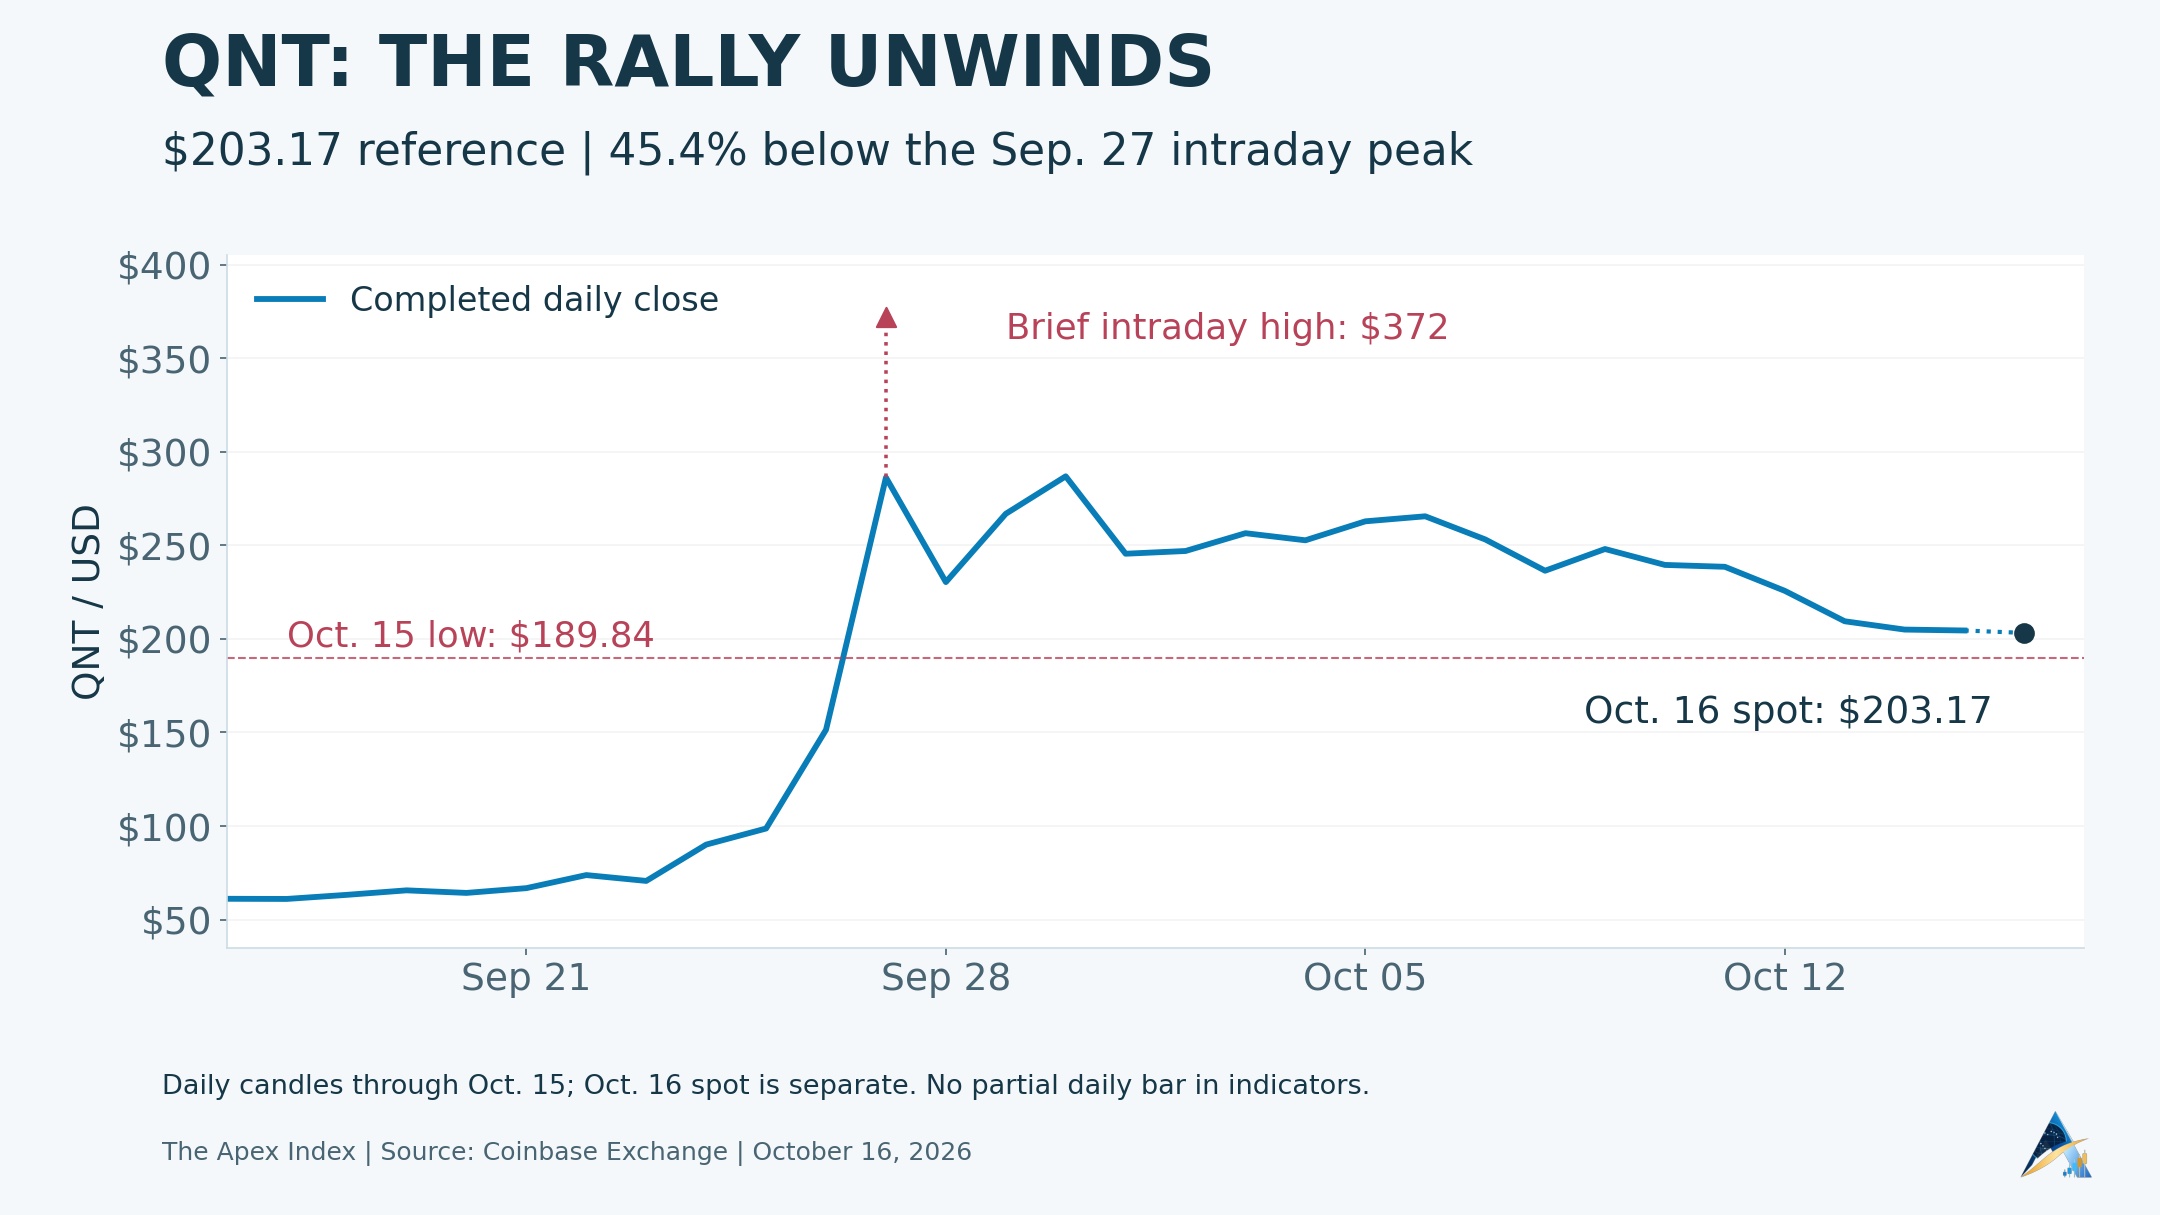
QNT is giving back a spectacular rally, and the rebounds are getting harder to sustain. The token traded near $203 on October 16, with CoinGecko showing a roughly 3.6% decline over 24 hours. On Coinbase, a $203.17 reference trade put it 45.4% below September 27's brief $372 high.
The strongest explanation is an overheated advance losing momentum, followed by a break below its short-term trend. Profit-taking and position reductions fit that pattern, although the trading data cannot identify every seller's motive. No fresh Quant hack, delisting or canceled partnership was verified for this analysis.
First, look at how far QNT had already run
The exchange's history shows QNT closing September 16 at $61.13. Even after this selloff, the $203.17 reference is about 232.4% higher. Anyone who bought before the late-September surge still has a very different experience from someone who chased its final spike.
The 45.4% drawdown needs that context too. It starts from an intraday extreme, rather than a daily closing price. Measured against September 30's $286.84 close, the decline is 29.2%. Both comparisons show substantial damage, but they describe different entry points.
The rally followed a substantial business announcement. On September 24, The Clearing House announced that it had selected Quant to power its On-Chain Money Initiative. The proposed network would let participating financial institutions clear and settle tokenized deposits, with availability expected in the first half of 2027.
Sal Karakaplan, The Clearing House's chief strategy officer, said:
The Clearing House has a long history of building and operating trusted payment networks that serve the banking industry. Quant brings the technology and expertise needed to support the network, giving financial institutions of all sizes a path to participate.
That announcement preceded QNT's most explosive price action. It also concerned infrastructure with a future rollout. Neither the announcement nor its timetable specified a QNT price target or a guaranteed amount of token buying. The distinction matters when a market moves several times faster than the underlying business can deliver results.
The daily chart has lost its short-term support
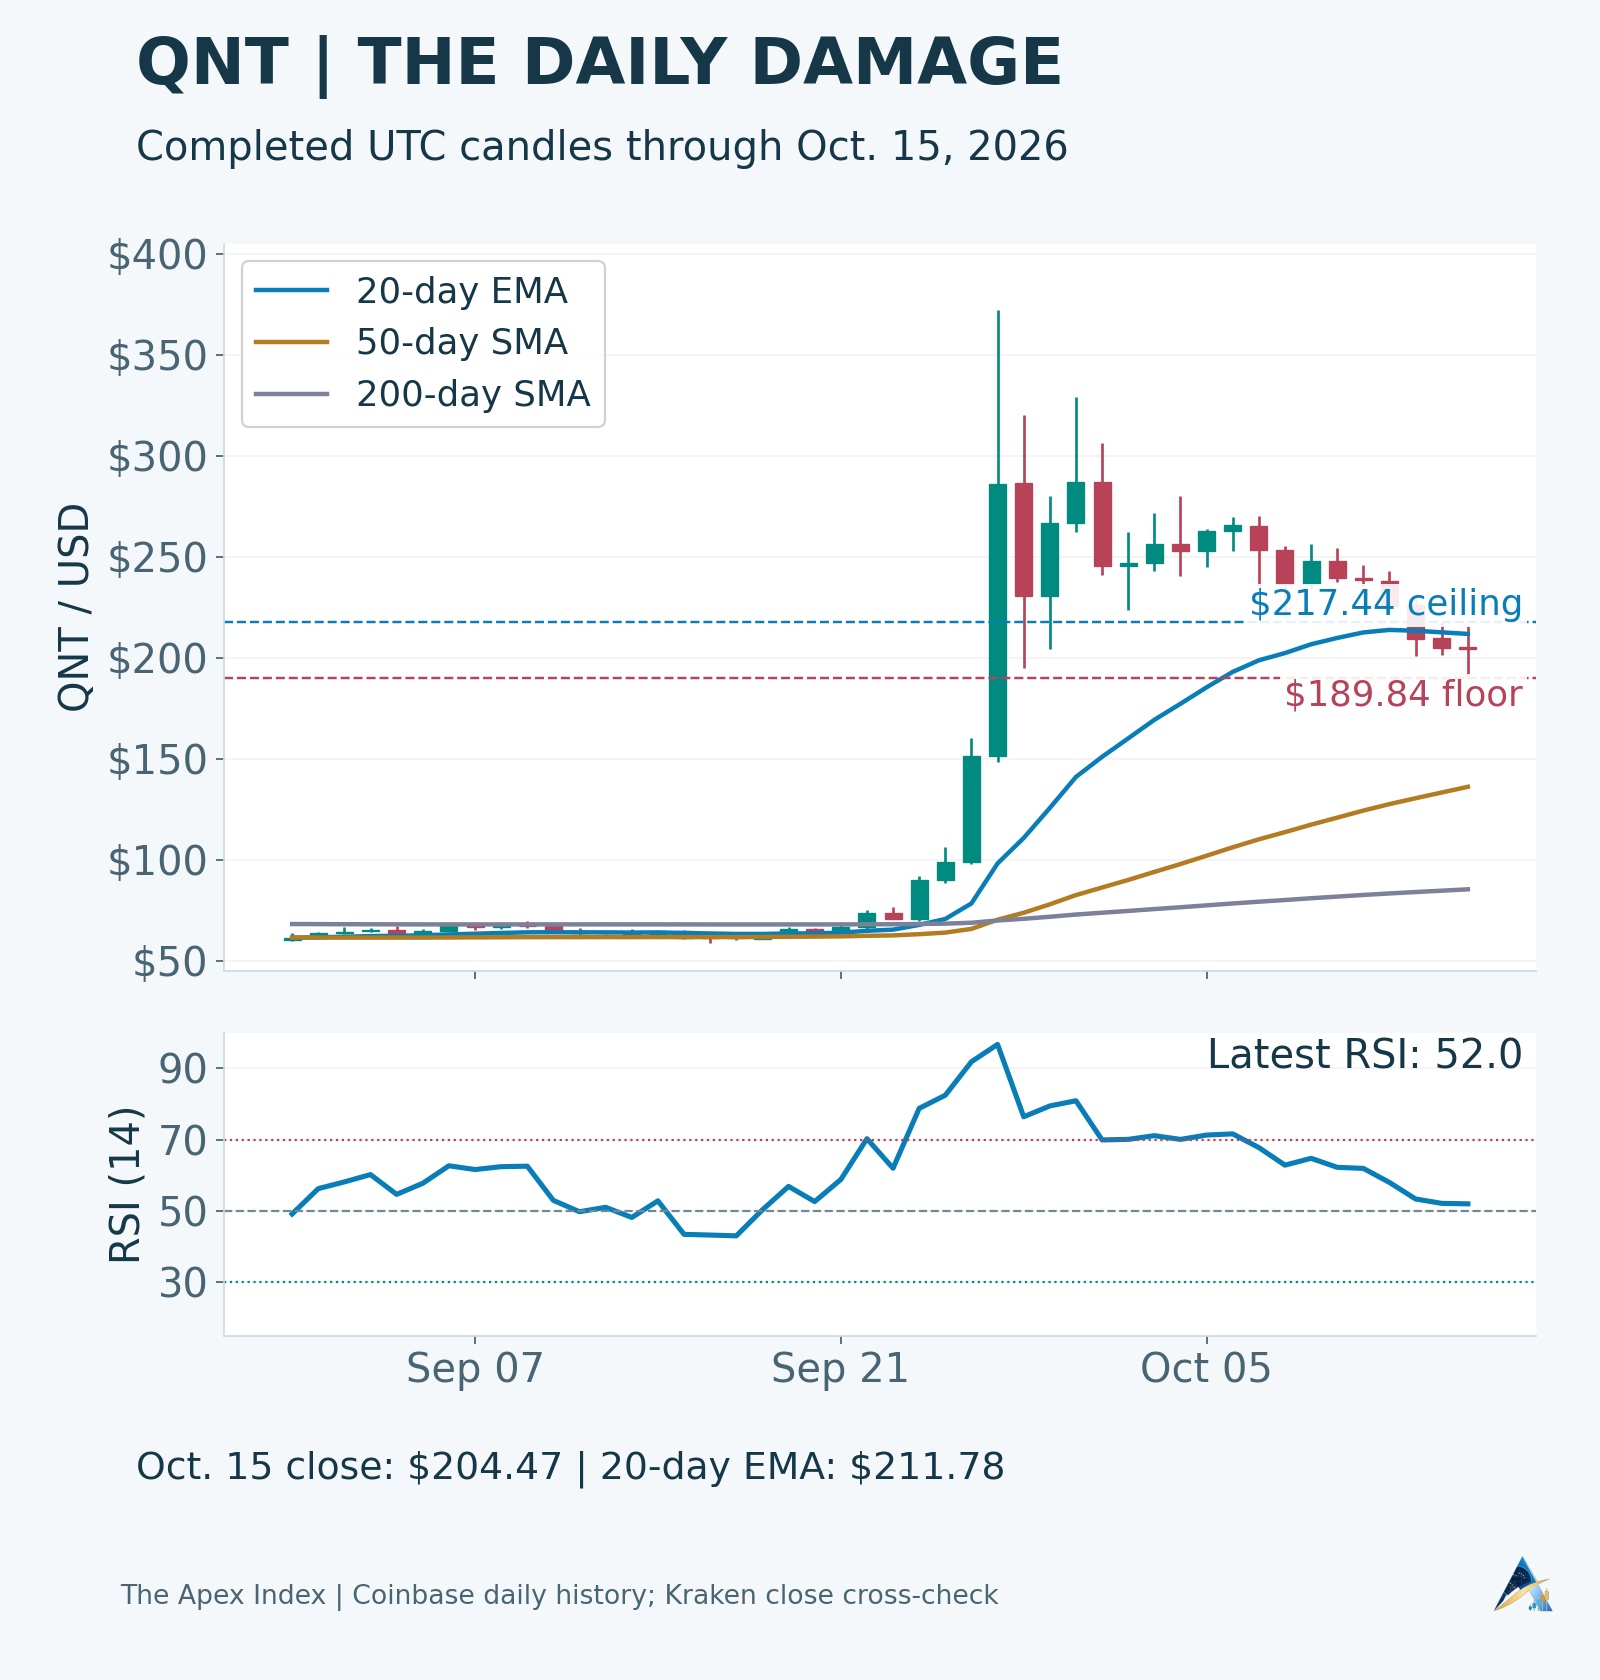
Using 289 completed daily candles through October 15, QNT's 20-day exponential moving average is $211.78. The latest completed close was $204.47, and the October 16 reference was lower again. Price has slipped beneath a widely watched short-term trend measure.
The sequence is fairly clear. QNT closed October 9 at $248, October 12 at $225.66 and October 15 at $204.47. The reference price is about 18.1% below that October 9 close. Each attempted recovery has left the market with more ground to regain.
Daily RSI is approximately 52, calculated with 14-period Wilder smoothing. That is near neutral, rather than the sub-30 reading commonly described as oversold. The earlier rally left considerable momentum in the calculation, so a large price decline has not automatically produced an oversold signal.
The longer averages tell a less alarming story: the 50-day simple moving average is $136.09 and the 200-day average is $85.34. QNT remains above both. The immediate problem is a sharp short-term reversal after an exceptional advance, with the older trend measures still reflecting that advance.
The wider market is weak, but QNT is weaker
In the same October 16 CoinGecko snapshot, Bitcoin was down about 0.8%, Ethereum down 0.1% and Solana down 1.5% over 24 hours. QNT's roughly 3.6% decline was appreciably larger.
As previously reported by Apex, Bitcoin has also struggled to repair its short-term trend. That is an unhelpful backdrop for smaller tokens, but QNT's much larger retreat from its September peak requires looking at its own extraordinary run-up and subsequent breakdown.
Futures activity adds another risk
CoinGlass's October 16 snapshot tracked approximately $390.6 million in rolling 24-hour QNT futures turnover, compared with $40.9 million in tracked spot turnover. It also showed about $110.3 million in open interest. Those are provider-specific coverage totals, rather than figures for every venue worldwide.
Heavy futures activity gives leveraged traders plenty of scope to amplify a move. Stop orders and forced position closures can accelerate selling when price crosses a crowded level. The available snapshot does not establish how much of this particular decline came from liquidations, so an exact forced-selling total would overstate the evidence.
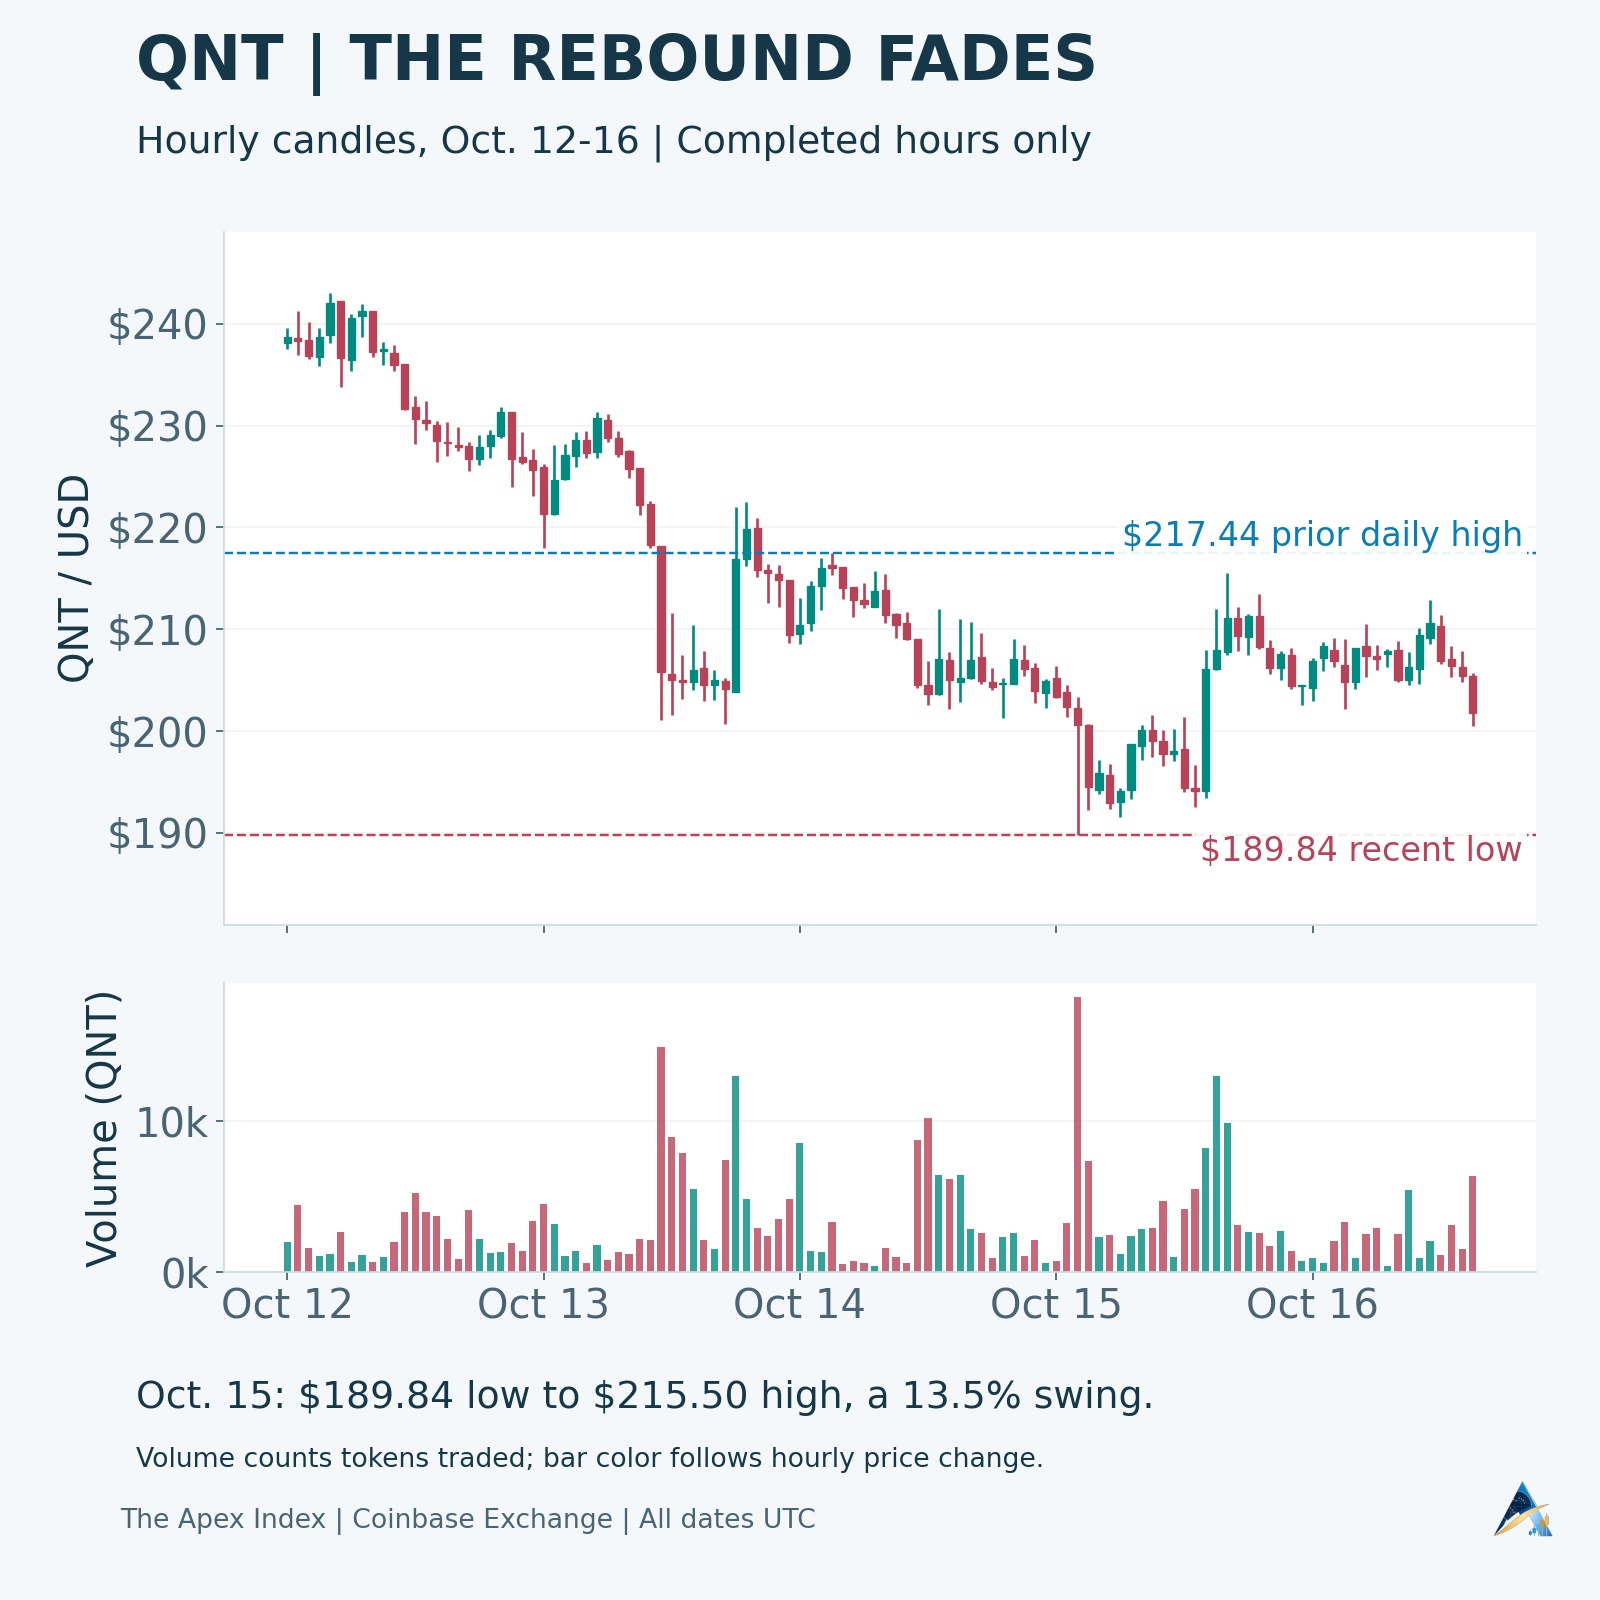
The hourly tape shows why chasing a bounce is difficult. On October 15, Coinbase recorded a $189.84 low and a $215.50 high, a 13.5% low-to-high rebound. That recovery failed to clear October 14's $217.44 high, and QNT was back near $203 in the reference snapshot.
What would stop the slide?
The first task for buyers is reclaiming the $211.78 daily EMA and then $217.44. Holding above that recent high would strengthen the recovery case. The next observed hurdle is October 13's $231.29 high, where another rebound could meet resistance.
On the downside, $200 is the nearby round-number test. The more concrete recent low is $189.84. A daily close below it, followed by a failed attempt to recover it, would leave the short-term breakdown much harder to dismiss as an intraday shakeout.
To size a possible breakout, the October 14-15 range spans $27.60, from $189.84 to $217.44. Extending one range width below the floor gives $162.24, about 20.1% below the reference. Extending it above the ceiling gives $245.04, about 20.6% higher. These are arithmetic projections activated by a sustained break, with no statistical probability attached.
Has the business story changed?
Quant's October 15 commentary, relevant background to the token's investment narrative, continued to describe the move toward connected banking networks. Martin Hargreaves wrote:
Issuing digital commercial bank money inside one institution is now well understood. The harder task is moving it between banks, across borders and onto the settlement rails that already underpin the financial system.
The same article retained the first-half-2027 expectation for The Clearing House's initiative. That leaves investors weighing future implementation against a token price that had already surged. It gives no reason to assume that every business milestone must immediately send QNT higher.
For now, the clearest answer sits in the price action: a huge rally has unwound, the short-term average has been lost, and a strong bounce has failed to repair the damage. Buyers need to turn $211.78-$217.44 back into support. Until then, $189.84 remains the level that separates a shaky recovery attempt from another leg down.