

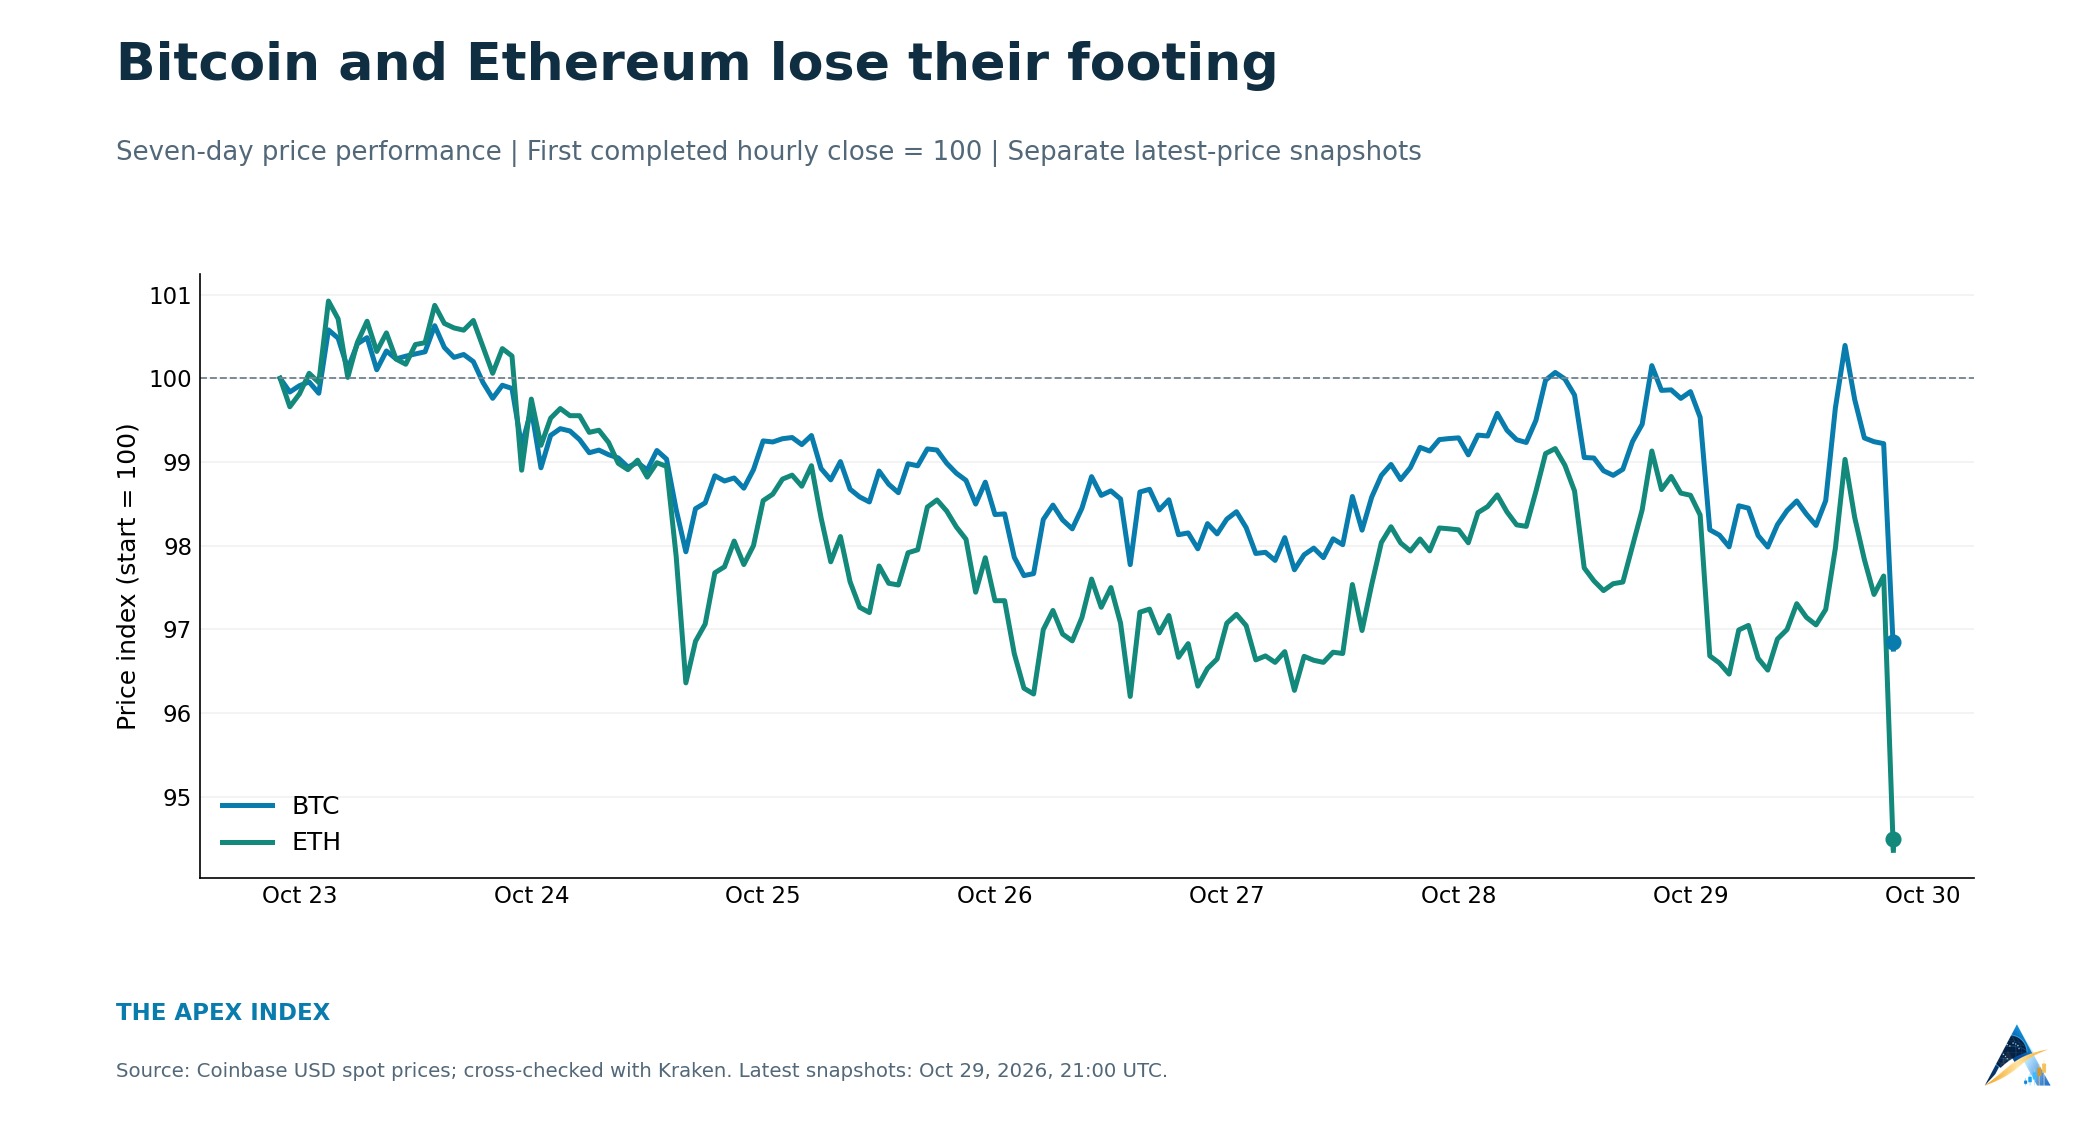
Bitcoin and Ethereum are falling as stubborn U.S. inflation, a tough Federal Reserve stance and selling in technology stocks put pressure on riskier investments. Both coins have broken below their lows from the previous seven completed days, with ether taking the bigger hit.
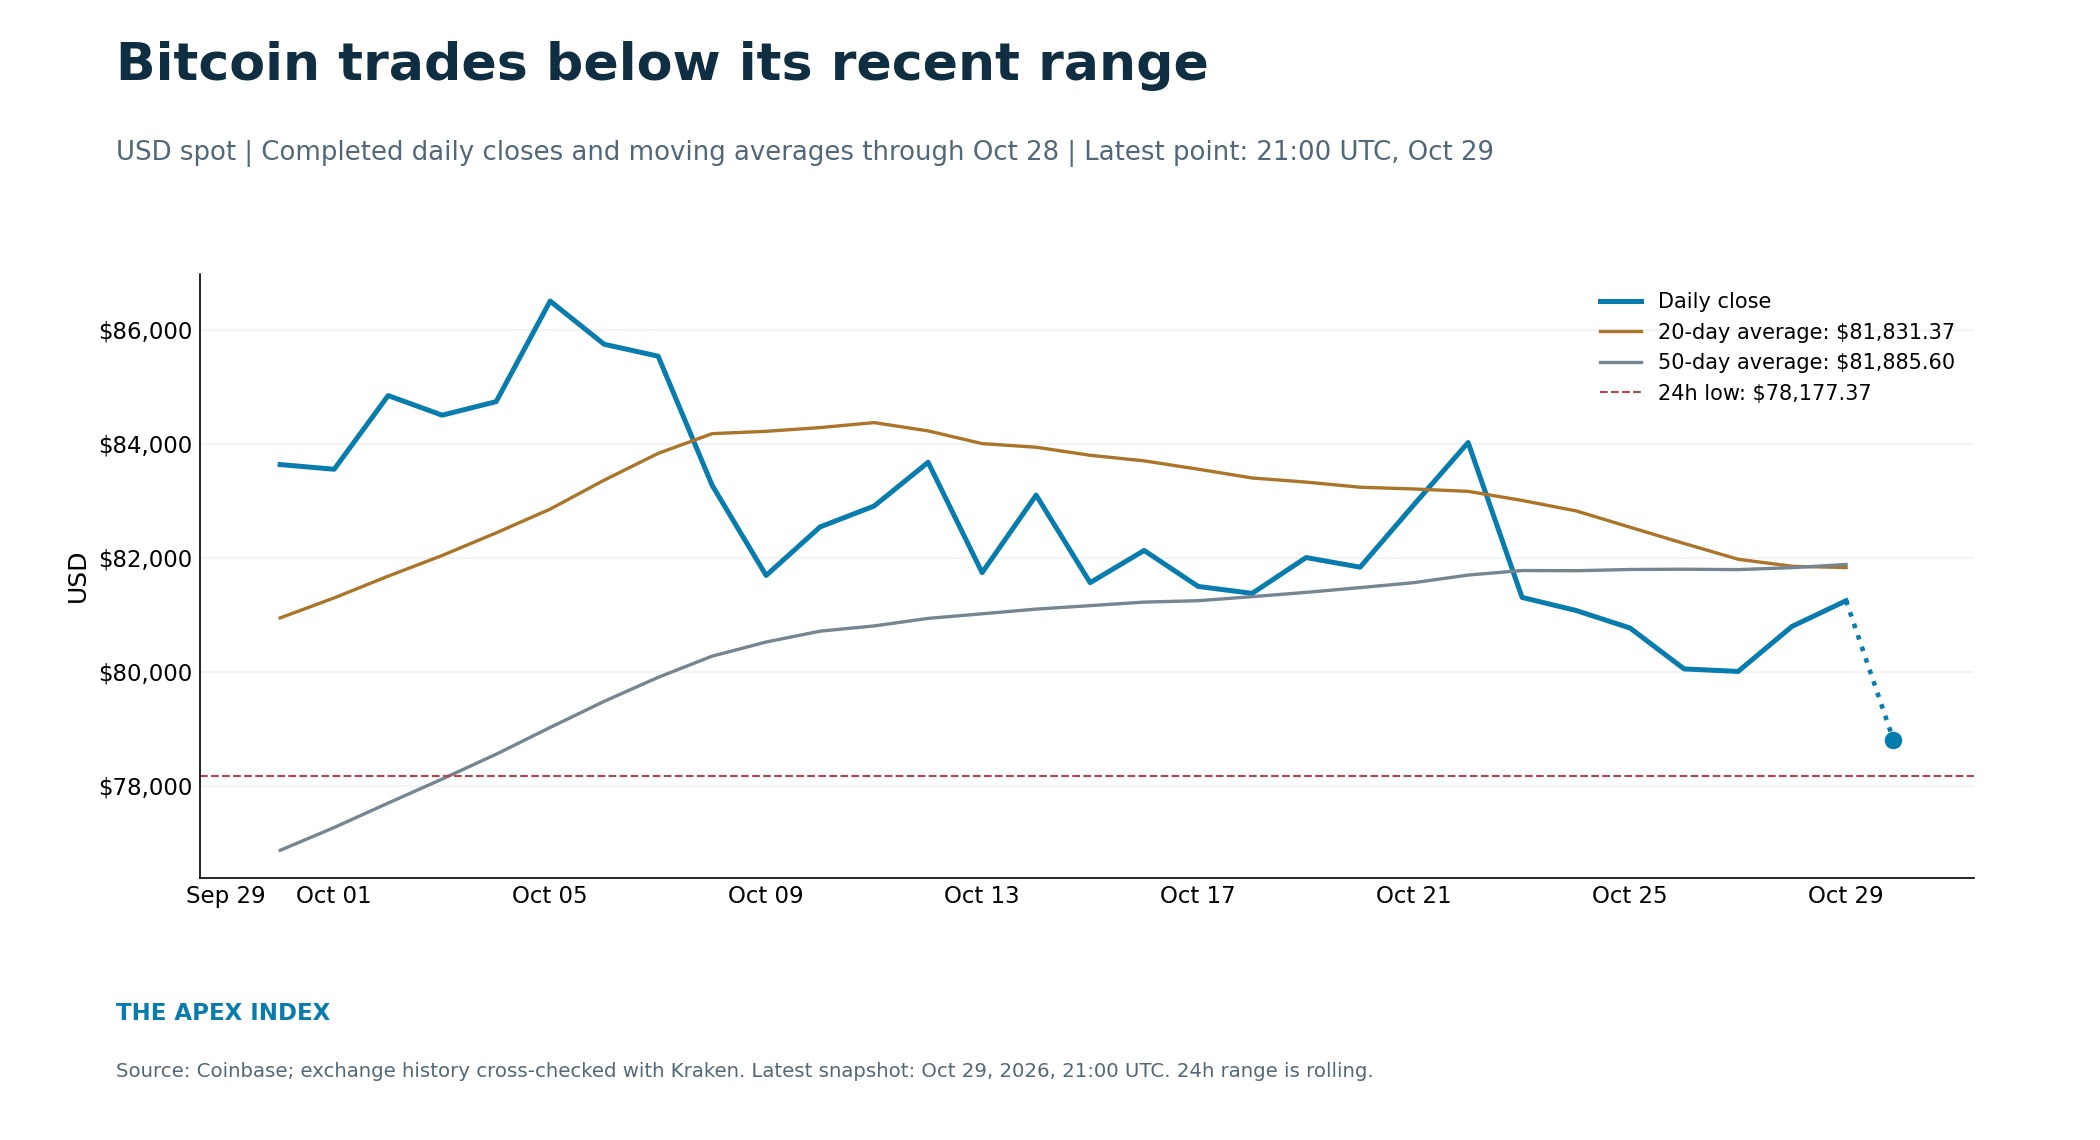
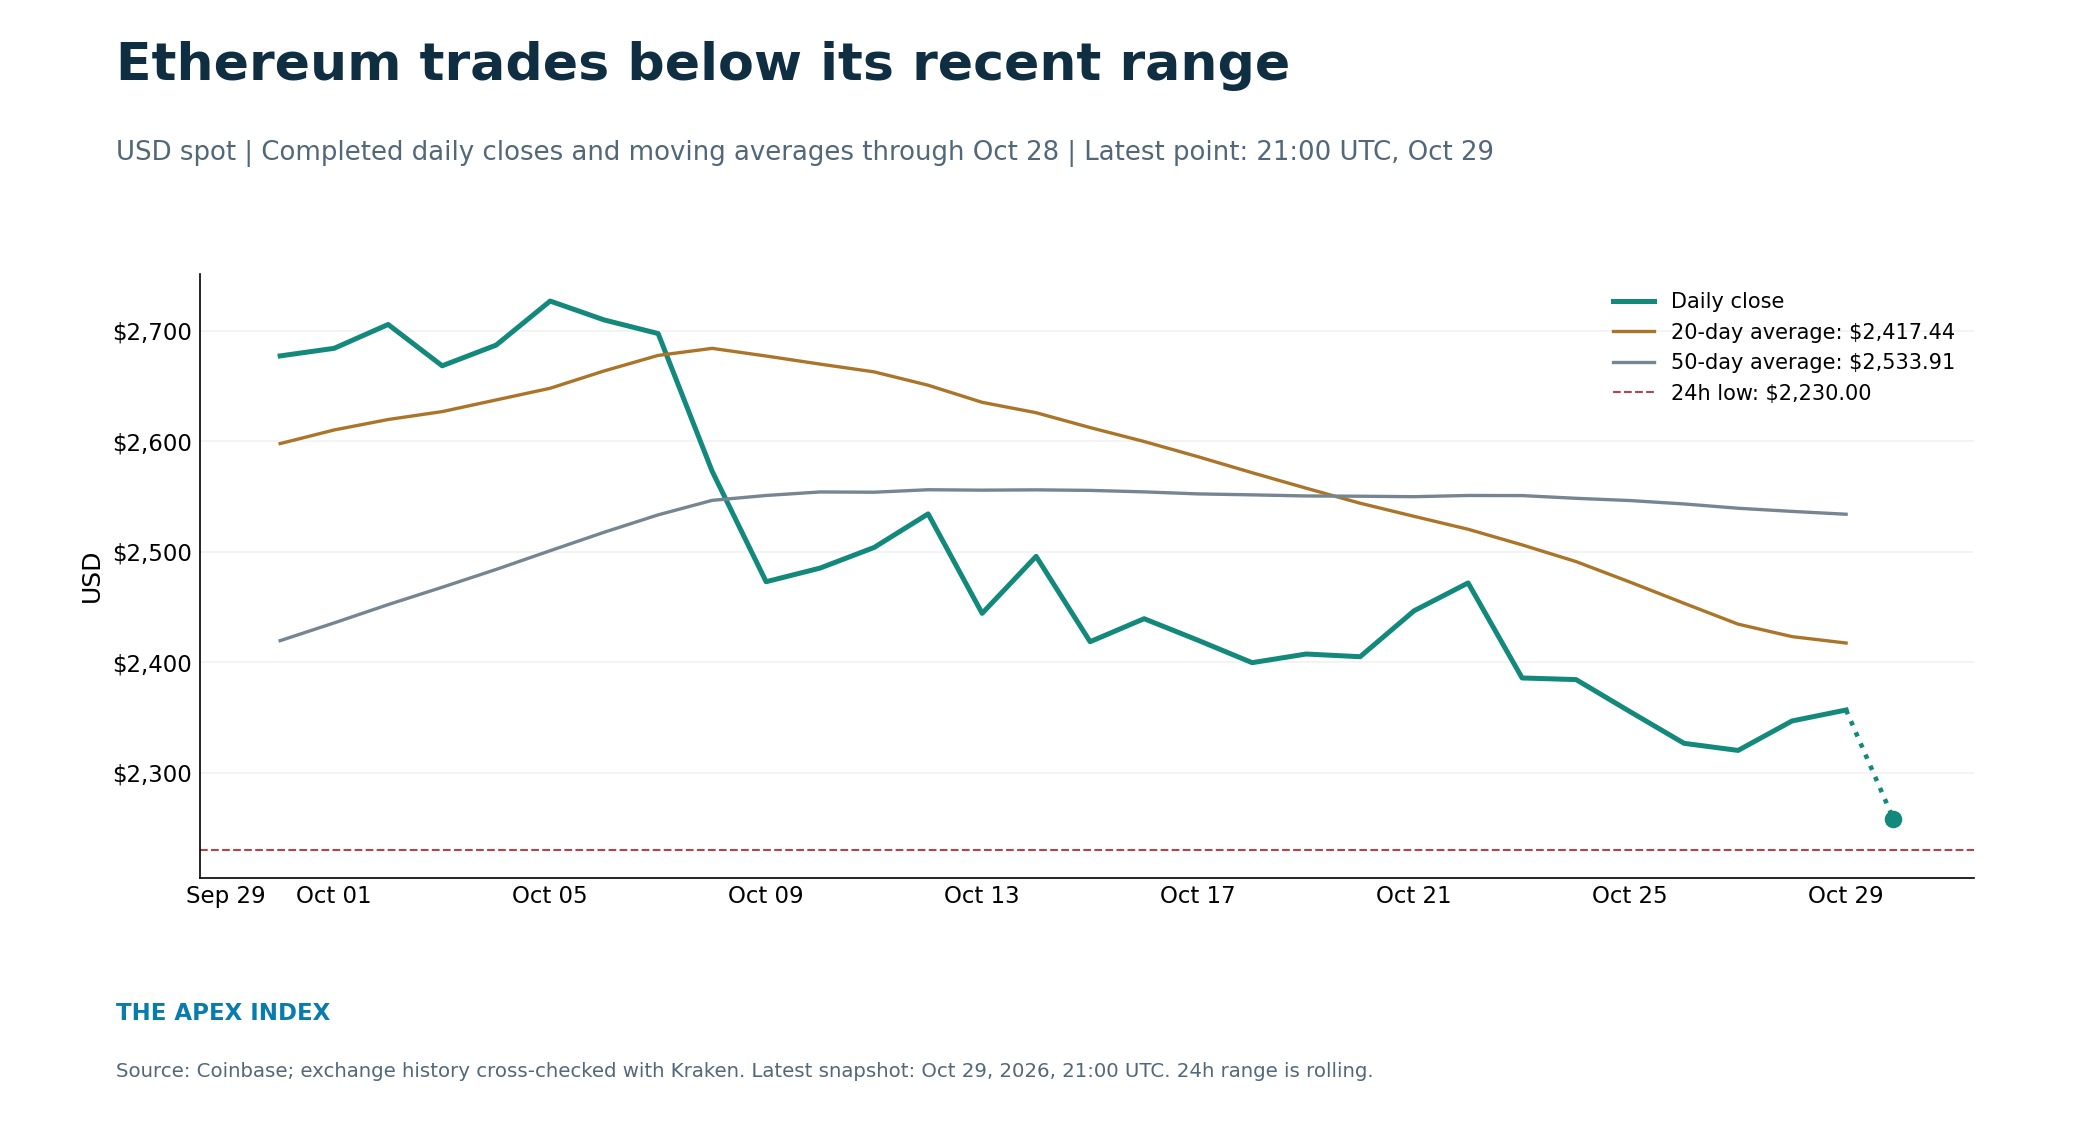
At 21:00 UTC on October 29, Coinbase's BTC-USD market showed bitcoin at $78,811.90, down 3.01% over the previous 24 hours. Ether traded at $2,258.58, down 4.24%. These are exchange-specific spot readings, not final daily closing prices.
Why the selling has picked up
The latest inflation figures give investors little reason to assume borrowing costs will fall quickly. The Bureau of Economic Analysis reported Thursday that September's PCE price index rose 0.5% from August and 3.6% from a year earlier. Core inflation, which excludes food and energy, was 3.1% annually.
As previously reported by Apex, the Fed kept its policy rate at 3.75%-4.00% on October 28. Its statement showed that the disagreement was over raising rates:
Voting against the monetary policy action were Lisa D. Cook and Beth M. Hammack, who preferred to raise the target range for the federal funds rate by 1/4 percentage point at this meeting.
High rates give investors a return on cash and government debt while making borrowing more expensive. That is an unfavorable backdrop for speculative assets, though it cannot explain every trade in bitcoin or ether.
Technology stocks added another source of pressure. CoinDesk linked Thursday's earlier crypto selling to disappointing reactions to Samsung and Alphabet earnings. Intel then delivered weak fourth-quarter guidance after the U.S. close, sending its shares sharply lower, as Apex reported in the related coverage below. These moves show investors cutting exposure across several growth-sensitive markets, rather than a problem confined to one cryptocurrency.
ETF flows tell a more mixed story
There is no evidence in the latest completed ETF data of a uniform rush out of both assets. Farside Investors' figures show U.S. spot bitcoin ETFs received $137.3 million on October 28, their third consecutive day of net inflows. U.S. ether ETFs, by contrast, lost $21.4 million that day.
Thursday's fund-by-fund entries were still unreported in those tables when checked. The displayed zero total for October 29 therefore wasn't a completed day's result. Yesterday's flows show different demand for the two assets; they do not establish who is selling in the current session.
Options traders are paying for protection
Friday's monthly options settlement adds another near-term concern. CoinDesk reported that $10.86 billion of bitcoin options and $783 million of ether options would expire on Deribit on October 30. Those are contract notionals, not a forecast of money that must be sold.
Jean-David Pequignot, Deribit's chief commercial officer, described the demand for downside protection:
The break below $80,000 has pushed BTC's front-end 25-delta skew heavily toward puts at >10v over calls.
That means comparable options protecting against a decline were more expensive in volatility terms than options benefiting from a rise. The pricing shows concern about further losses. It doesn't guarantee that prices will fall when the contracts expire.
Bitcoin: $80,000 is the first recovery test
Coinbase's rolling 24-hour low was $78,177.37. Below that, $78,000 and $75,000 are round-number reference points for a downside scenario, not guaranteed support or measured price targets.
For a rebound to look more convincing, BTC would first need to recover $80,000 and hold above it. Its 20-day and 50-day simple moving averages, calculated from completed UTC daily closes through October 28, were about $81,831 and $81,886. That puts a second recovery test around $81,800-$81,900. Repeated rejection below those levels would leave the recent breakdown intact.
Ethereum: $2,230 is the nearby low
Ether's rolling 24-hour low was $2,230, already below the $2,275.94 low from the preceding seven completed days. A break under the latest low would put the round-number $2,200 level in focus; a deeper $2,000 scenario would require further selling and is not an assured destination.
On the upside, $2,300 is the first psychological hurdle. The 20-day average was about $2,417 and the 50-day average about $2,534, using the same completed-day method as bitcoin. Recovering $2,300 without getting back toward the shorter average would still leave ETH below its recent trend.
The bearish setup would weaken if buyers reclaimed those recovery levels and sustained the move. Fresh breaks below the quoted lows would favor the opposite scenario. These levels depend on the stated snapshot; crypto trades continuously, and the unfinished October 29 candle can still change.