
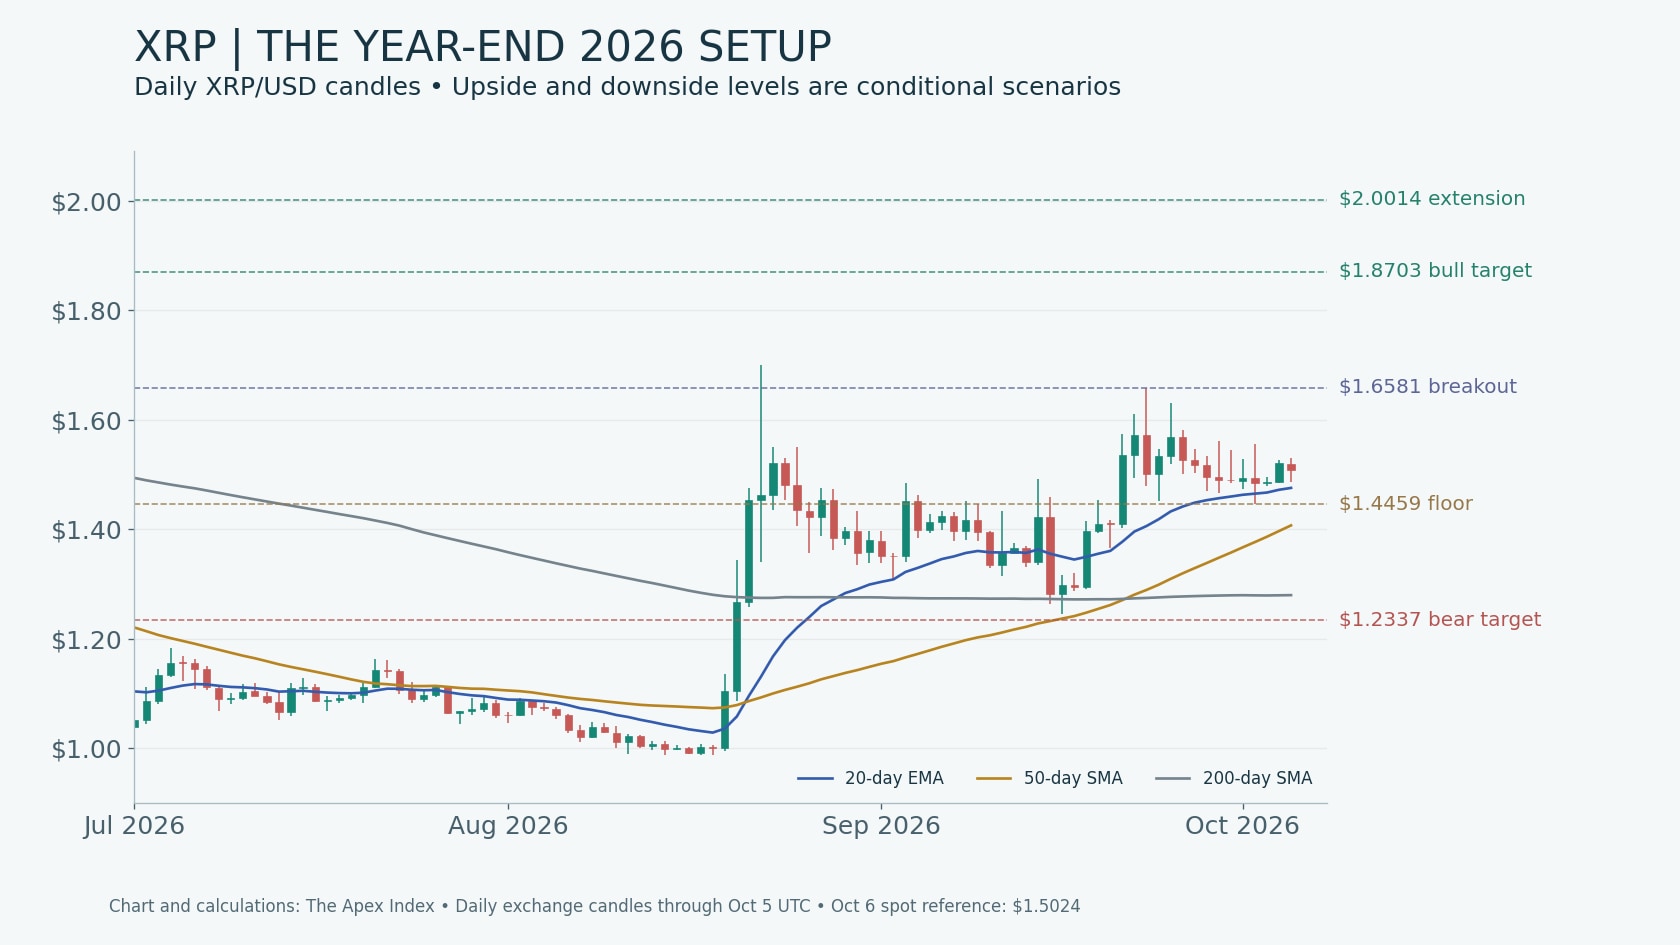
XRP's year-end technical framework has a conditional upside zone of $1.87–$2.00 and a downside zone of $1.23–$1.28. The dividing levels are approximately $1.66 overhead and $1.446 underneath. Holding between those boundaries leaves both projections unactivated; neither is a guaranteed December 31 closing price.
The October 6 CoinGecko spot snapshot put XRP at $1.50, updated at 20:13:30 UTC. A subsequent exchange quote showed $1.5024 at 20:15:29 UTC. That second figure is the reference for percentage moves below.
This extends our earlier XRP drawdown analysis with a fresh, two-sided chart framework. The forecast horizon runs through December 31, 2026, so weekly acceptance matters more than a brief intraday excursion beyond resistance.
Daily momentum versus the larger weekly structure
The TradingView daily technical snapshot for Bitstamp's XRP/USD pair placed the 20-day exponential moving average near $1.478, the 50-day simple moving average near $1.417 and the 200-day simple moving average near $1.280. Price above all three supports a recovery trend. It does not erase the larger decline from January's high.
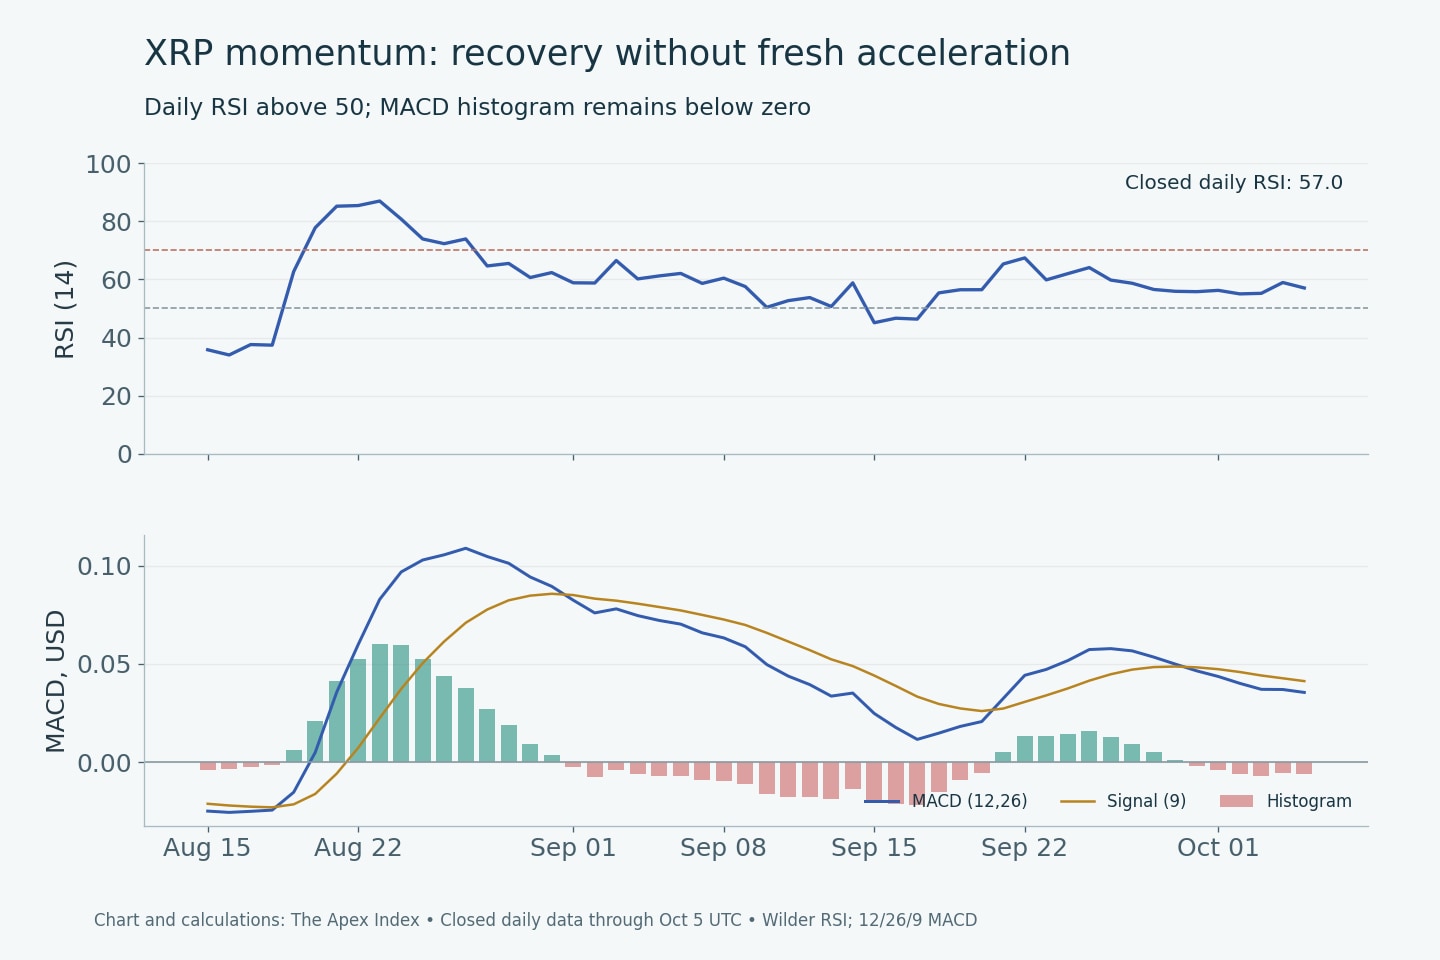
Daily RSI was approximately 56.2, above the neutral 50 threshold but short of strong overbought momentum. ADX was around 44.1, indicating directional persistence without independently specifying direction. MACD remained positive near $0.0335 but below its signal near $0.0397, leaving a negative histogram around −$0.0062. The trend is positive; its acceleration is weaker.
The Apex Index calculated the accompanying charts from Coinbase Exchange daily candles. The incomplete October 6 candle is excluded. Through the October 5 close of $1.5077, Wilder-smoothed 14-day RSI was approximately 57.0 and the 12/26/9 MACD histogram was −$0.0058. These are completed-bar calculations, separate from the live provider readings.
The recent trading structure is bracketed by the September 23 high of $1.6581 and October 2 low of $1.4459. Its width is $0.2122. A confirmed departure from that structure is the trigger for the measured-move projections, rather than the calendar itself.
Closed-candle 14-day average true range was approximately $0.0768, roughly 5.1% of the reference price. The range spans about 2.8 ATRs. A one-day move of a few cents can therefore remain ordinary noise inside the structure. ATR is a trailing range measure; multiplying it by the remaining days would not produce a valid year-end confidence interval.
The daily Bollinger upper band, calculated from a 20-period average and two standard deviations, was approximately $1.627. It sits below the $1.658 resistance. A touch of the band would not establish a breakout; sustained closes outside it, followed by acceptance above the range ceiling, would provide stronger continuation evidence.
CoinGlass's XRP derivatives snapshot showed approximately $3.53 billion of open interest, $2.76 billion of 24-hour futures turnover and $434.46 million of tracked spot turnover. Futures turnover was about 6.36 times spot turnover within that provider's coverage. Open interest is outstanding contract exposure, not a directional vote. A high turnover ratio cannot by itself prove crowded longs or an imminent squeeze.
The confirmation test is price acceptance supported by spot participation and improving momentum. Rising open interest alongside a failed breakout would be less constructive. No current funding-rate direction or liquidation heatmap is established by these retrieved figures, so specific squeeze levels are not asserted.
Year-end upside, downside and invalidation levels
The broader retracement anchors are the January 6 high of $2.4168 and August 17 low of $0.9873. The 38.2% recovery level is approximately $1.5334, the 50% level $1.7020 and the 61.8% level $1.8707. XRP near $1.50 is still below the first of those thresholds, despite its improved daily moving-average structure.
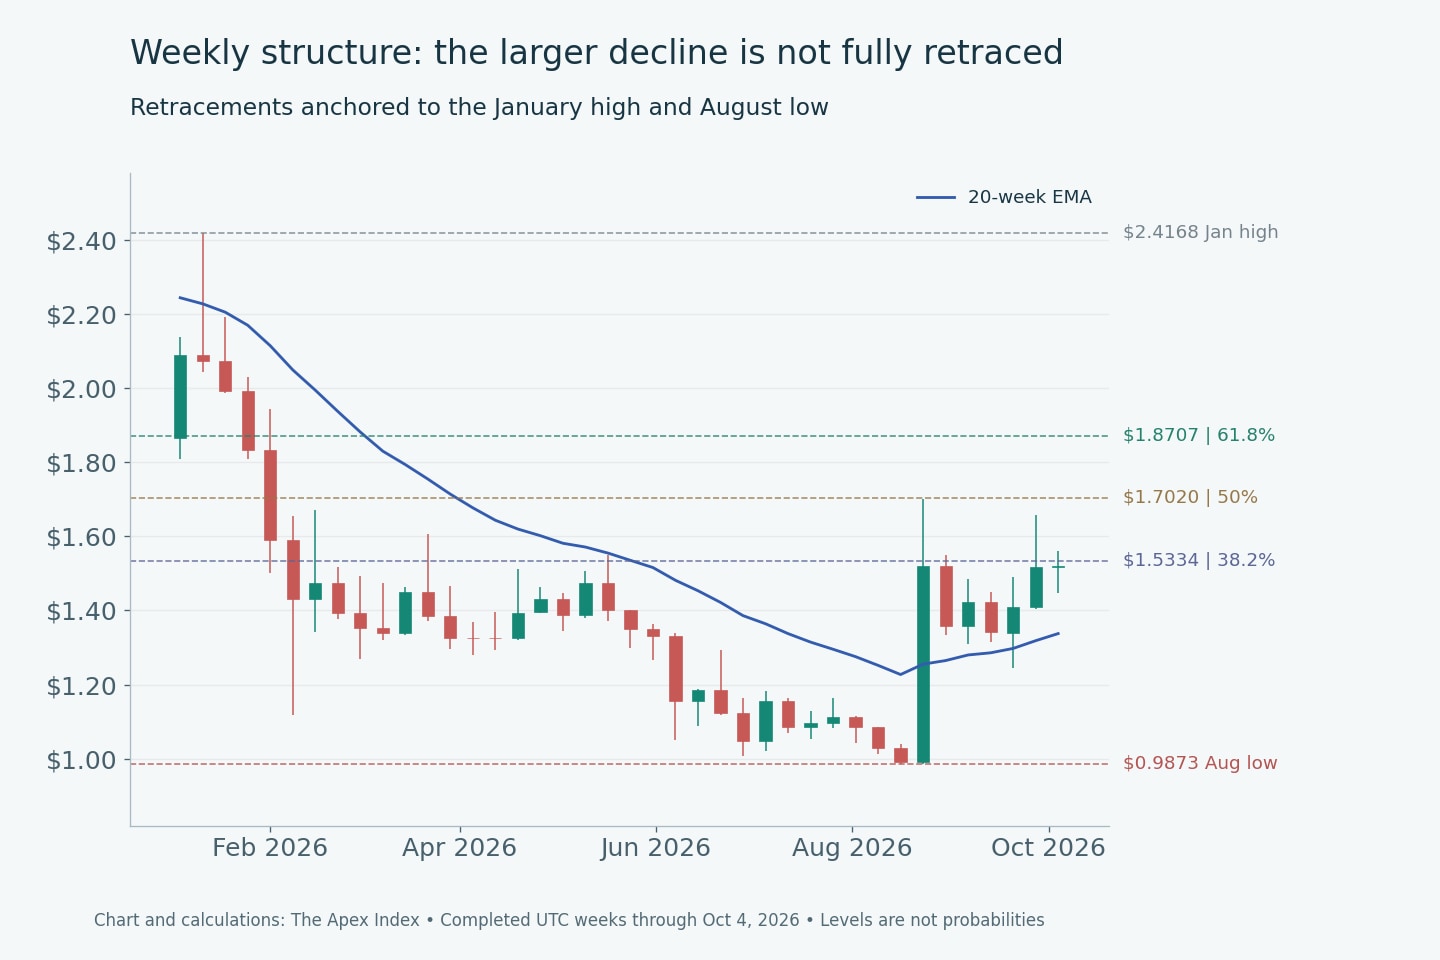
The completed week ending October 4 closed at $1.5203, above the approximately $1.338 20-week EMA but below the 38.2% retracement. That combination describes an intermediate recovery inside a larger drawdown. It supports monitoring higher targets without treating the decline as fully repaired.
The bullish scenario requires a daily breakout above approximately $1.66, a retest that holds and subsequent weekly acceptance near $1.70. The August 22 high of $1.6996 and the 50% retracement cluster there. Failing at that cluster would weaken the case for a sustained move toward $2.
The first measured-move target is $1.6581 + ($1.6581 − $1.4459), or $1.8703. Its proximity to the $1.8707 retracement creates a practical $1.87 resistance zone. These two calculations share price-based inputs and should not be mistaken for independent statistical confirmation.
Adding 1.618 times the same range width above its ceiling produces $2.0014. The resulting $1.87–$2.00 bullish zone is roughly 24.5%–33.2% above the reference price. Acceptance above $2 would open an extended recovery path toward the 78.6% retracement near $2.111 and January's $2.417 high. Those are secondary retest levels, not the central forecast.
The bearish scenario begins with a sustained daily loss of $1.4459 and a failed reclaim. The closed-candle 50-day average near $1.407 is the next trend test, followed by the weekly EMA near $1.338. Failure through those areas would expose the 200-day average around $1.280 and September 16 low of $1.2460.
A downside range projection subtracts $0.2122 from $1.4459, giving $1.2337. That defines the $1.23–$1.28 bearish zone, approximately 14.8%–17.9% below the reference. Losing the September swing low and failing to recover would bring August's $0.9873 low back into view, roughly 34.3% lower. That is a deeper stress scenario, not a guaranteed floor.
For either breakout direction, completed daily spot volume should be compared with its approximately 113.4 million XRP 20-day average. Expanding participation and a MACD histogram turning with the move would strengthen confirmation; a price wick followed by a close back inside the range would undermine it.
NOTE: Our Bitcoin Uptober technical framework provides a separate market reference, but its October seasonality is not mechanically transferred to XRP. This analysis uses XRP's own daily and weekly structure. All three charts are dated snapshots created and calculated by The Apex Index; the linked provider pages supply updating data. The target zones identify conditional price tests before year-end, not a modeled terminal-price distribution.