

An oil price can rise before a single extra barrel has disappeared from the market. Traders may be reacting to a threat to future deliveries, a stronger demand forecast or tighter supplies at a particular delivery hub. The price is responding to what people believe they can buy and sell, now and later.
That is why "oil went up" is only the beginning of an explanation. You need to know which oil, for what delivery period, in which currency and compared with what. From there, you can connect the headline with the physical supplies, financial contracts and local fuel costs underneath it.
There is more than one oil price
Crude oil comes in different grades and is delivered to different places. Its density and sulfur content affect how refineries can process it and which products they can make. Transport costs, access to pipelines and the location of buyers also influence the price of a particular cargo.
Benchmarks provide reference points. Brent is widely used in international oil pricing, while West Texas Intermediate, or WTI, is a major U.S. reference. Prices for other grades can be agreed at a premium or discount to a benchmark, depending on quality and delivery conditions.
Even within a benchmark, a spot assessment and a futures quote describe different transactions. Spot pricing concerns physical oil for near-term delivery under the relevant market convention. A futures contract refers to a specified contract month and has its own delivery or settlement terms.
When comparing headlines, match the benchmark and contract month. An expiring front-month contract can behave differently from a later one, and a chart that switches between months can show changes partly related to that switch.
Supply and demand set the basic pressure
The world needs a flow of oil for transport, industry, petrochemicals and other uses. Producers supply that flow, while inventories absorb differences between production and consumption. Prices help coordinate decisions about what to produce, buy, store and use.
The U.S. Energy Information Administration's framework organizes the main drivers around physical supply, demand, inventories and financial markets. None operates alone. A production cut can have a different effect in a growing economy from the same cut during a sharp fall in consumption.
Demand and supply also take time to adjust. A driver cannot immediately replace a vehicle every time fuel becomes expensive, and a new oil project cannot begin production just because this morning's price increased. That limited short-term flexibility helps explain why a modest change in available supply can produce a much larger price response.
Over longer periods, people can change travel habits, businesses can improve efficiency and producers can invest in new capacity. Those responses can soften pressure, but their speed and cost vary. The same price move can therefore mean different things over a few days and several years.
What OPEC and OPEC+ can influence
OPEC coordinates production policy among its members. OPEC+ includes additional producing countries, including Russia. Decisions about targets, voluntary cuts or increases can change expectations about how much oil will reach buyers.
A target is not the same as actual output. Countries can produce above or below announced levels, and operational problems can prevent an intended increase. Follow production and exports alongside the meeting statement rather than assuming every announced barrel immediately arrives.
Spare capacity matters because it offers a possible response to an interruption elsewhere. The EIA defines it as production that can be brought online within 30 days and sustained for at least 90 days. Its location and ability to reach consumers still matter when transport routes are disrupted.
Other producers respond to their own costs, financing, geology and investment plans. OPEC decisions can influence prices without giving the group complete control over global demand, nonmember production or the timing of every disruption.
Inventories connect today's market with tomorrow's
When supply exceeds use, oil and refined products can accumulate in storage. When use exceeds incoming supply, inventories can be drawn down. Stocks provide a buffer, but available capacity and usable supplies differ between locations and products.
The EIA's inventory explanation describes that balancing role. A stock build can suggest a looser market, while a draw can indicate tighter conditions. Neither is a complete verdict without context: refinery activity, imports, exports and the time of year can all change the reading.
For example, refineries undergoing maintenance may buy less crude, allowing crude inventories to rise even while fuel inventories fall. Looking only at the crude headline could miss pressure in diesel or gasoline. Compare the parts of the report rather than treating every increase as automatically bearish.
Seasonality also matters. A winter heating-fuel draw and a summer gasoline draw can have different explanations. Compare stocks with appropriate seasonal history, and distinguish commercial inventories from government emergency reserves.
Keep stock levels and daily flows separate
Production and consumption are flows, commonly measured in barrels per day. Inventory is a stock of oil at a particular time, measured in barrels. A report describing a weekly inventory change isn't automatically describing a change of the same size in daily production.
For a fictional example, a draw of 14 million barrels over seven days averages 2 million barrels per day from storage. It does not establish that production fell by that amount. Imports, exports, refinery demand and other movements can contribute to the inventory change.
Also check the geography. A report about storage in one country or at one delivery hub does not cover all global inventories. Its importance depends on the market and products involved. Reading units and location carefully can prevent a large-looking number from being mistaken for a much bigger supply shock.
Why a threat can move prices before an outage
A credible risk to a major producing area, pipeline, terminal or shipping route can make future deliveries look less secure. Buyers may compete more aggressively for available cargoes, while traders adjust contracts to reflect the possibility of a shortage.
The extra price associated with that uncertainty is often described as a risk premium. It is not a separate fee printed on an invoice, and there is no directly observable, universally agreed amount for it. Analysts estimate its importance from market behavior and assumptions about the threat.
A threatening statement, damaged infrastructure, an actual production loss and a delayed shipment are different developments. Check which has been confirmed and how long the effect could last. A serious incident may have limited price impact if spare production, inventories or alternate routes can cover it.
Prices can also fall after alarming news if the outcome is less damaging than traders had already feared. What matters is the change relative to expectations, alongside the effect on real supplies.
Futures prices are a curve, not one forecast
A futures market offers prices for different contract months. Together those prices form a curve. When later contracts cost more than nearer ones, the structure is called contango. When nearer contracts cost more, it is called backwardation.
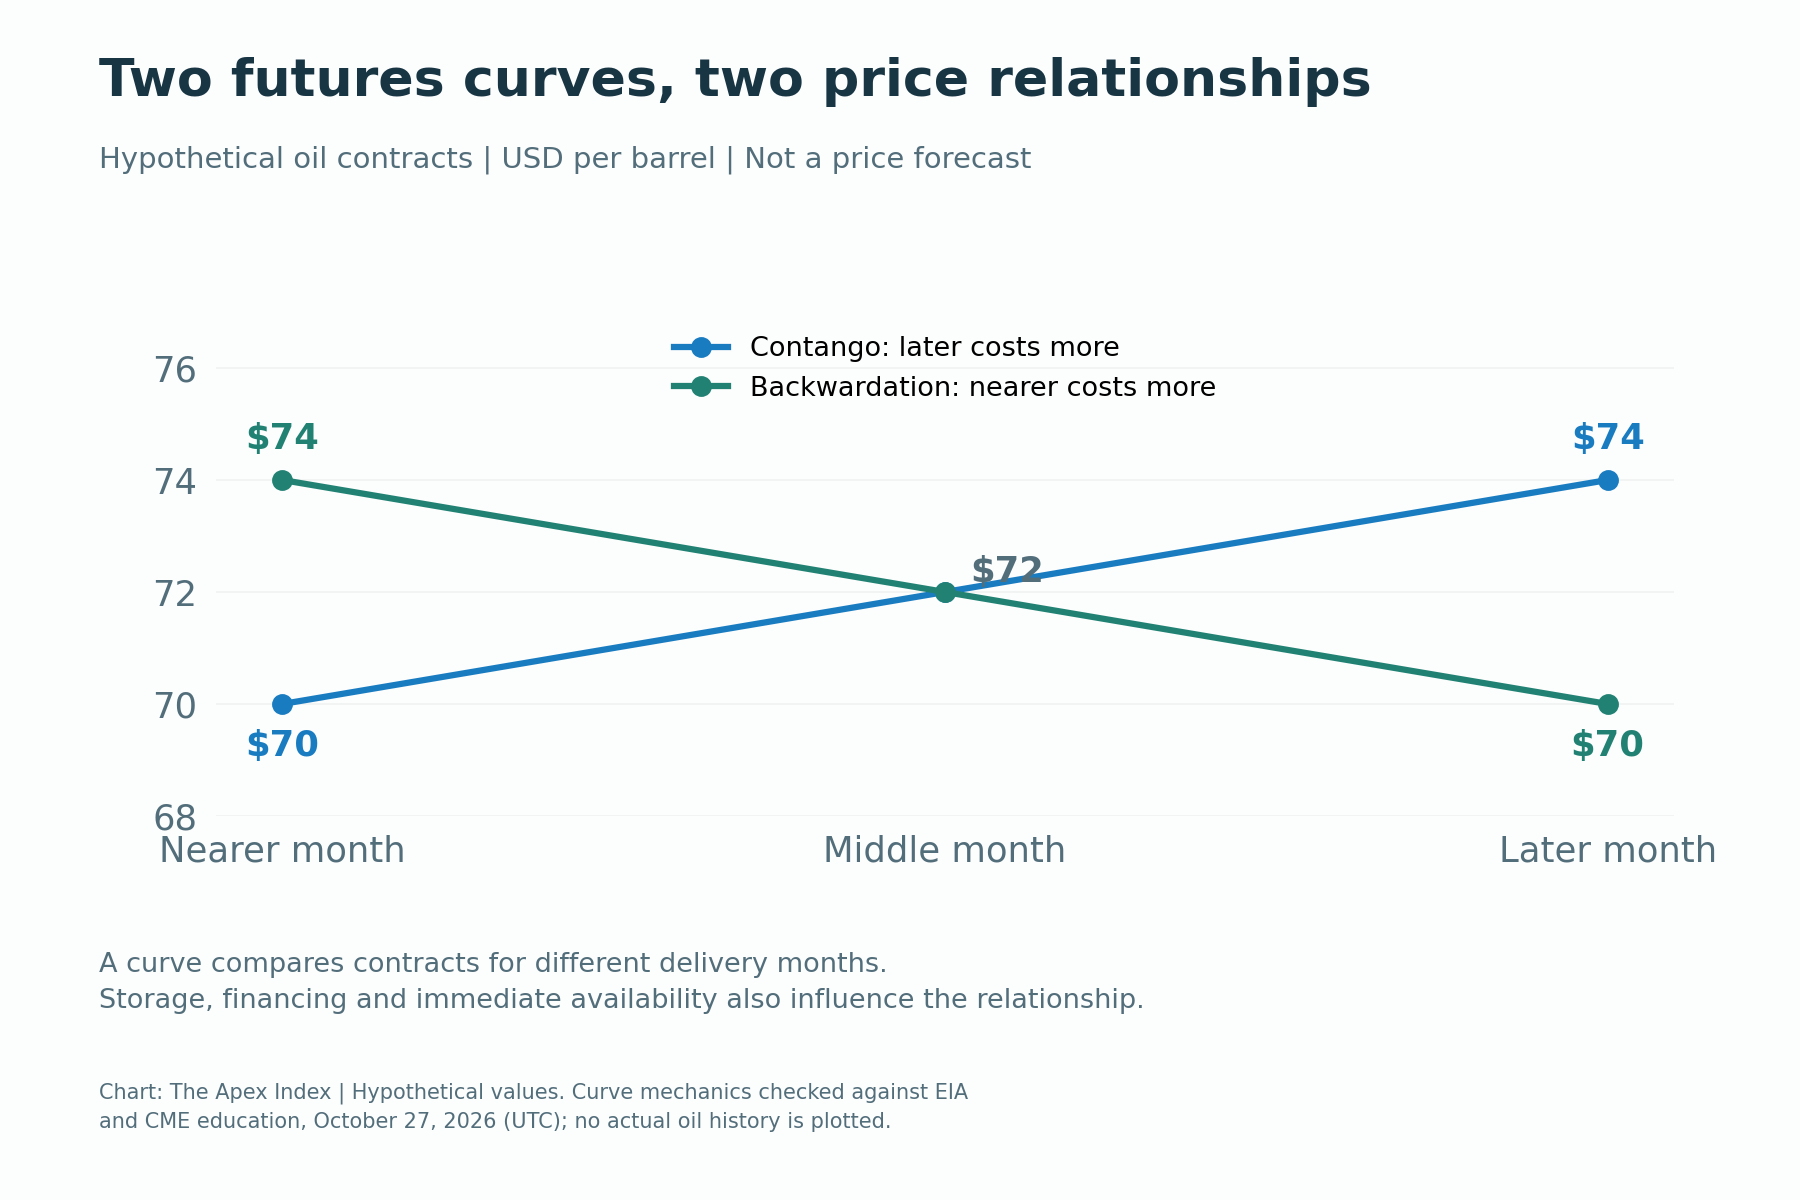
The two curves in the chart are hypothetical, not current quotations or forecasts. They show the relationship between delivery months. Storage costs, financing, the usefulness of having oil immediately available and expectations about supply and demand all help shape that relationship.
A higher future price is not a promise that the spot price will reach it. Physical holders can compare the cost of buying and storing oil with the price available for later delivery. Storage constraints or strong immediate demand can change those incentives and the curve's shape.
Hedgers use contracts to manage exposure, while other traders take financial positions. A producer might sell futures to reduce the risk of lower selling prices, and a fuel-consuming business might buy related contracts against rising costs. The hedge can be imperfect when its benchmark differs from the fuel or location actually needed.
The contract you buy determines the obligation
A futures position can involve a large underlying amount even when its initial margin is much smaller. The standard NYMEX WTI contract and ICE Brent futures each cover 1,000 barrels, although smaller products and different energy contracts also exist.
Delivery and settlement rules are important. WTI futures are tied to physical delivery at Cushing, Oklahoma. ICE Brent's specifications describe an exchange-for-physical delivery arrangement with an option to cash settle. Don't assume all oil contracts are settled in the same way.
Most retail investors don't want to handle physical crude. Check the broker's deadlines, margin rules and treatment of expiring contracts before entering a position. A plan to close before expiry still needs enough liquidity and time to execute.
Oil-priced investments can behave differently
Buying an oil producer's shares gives you exposure to a business, including its costs, debt, management and production mix. A rise in crude prices can help its revenue while other factors still hurt its earnings or share price. A producer, refiner and airline have different exposures to the same oil move.
A fund using futures can also differ from spot oil. When it replaces an expiring contract with a later one, the prices of those contracts affect how much exposure it can maintain for the same capital. Fees, collateral returns and the product's strategy add further differences.
Read the fund's actual holdings and rules instead of assuming the word "oil" means direct ownership of barrels at today's headline price. Leveraged or inverse products introduce additional features that need their own explanation; they are not interchangeable with an unleveraged oil investment.
Why the currency matters to an importer
Oil benchmarks are commonly quoted in U.S. dollars. A buyer whose revenues are in another currency must also consider the exchange rate. The same dollar price can become more expensive locally if that buyer's currency weakens.
Suppose a fictional importer pays $70 a barrel and exchanges 100 local currency units for each dollar. The crude cost is 7,000 local units. If oil rises to $84 with the exchange rate unchanged, the cost becomes 8,400 units, a 20% increase.
If the exchange rate also moves to 120 local units per dollar, the same $84 barrel costs 10,080 units. That is 44% above the starting cost. The calculation multiplies two changes; adding 20% for oil to 20% for currency would miss their combined effect.
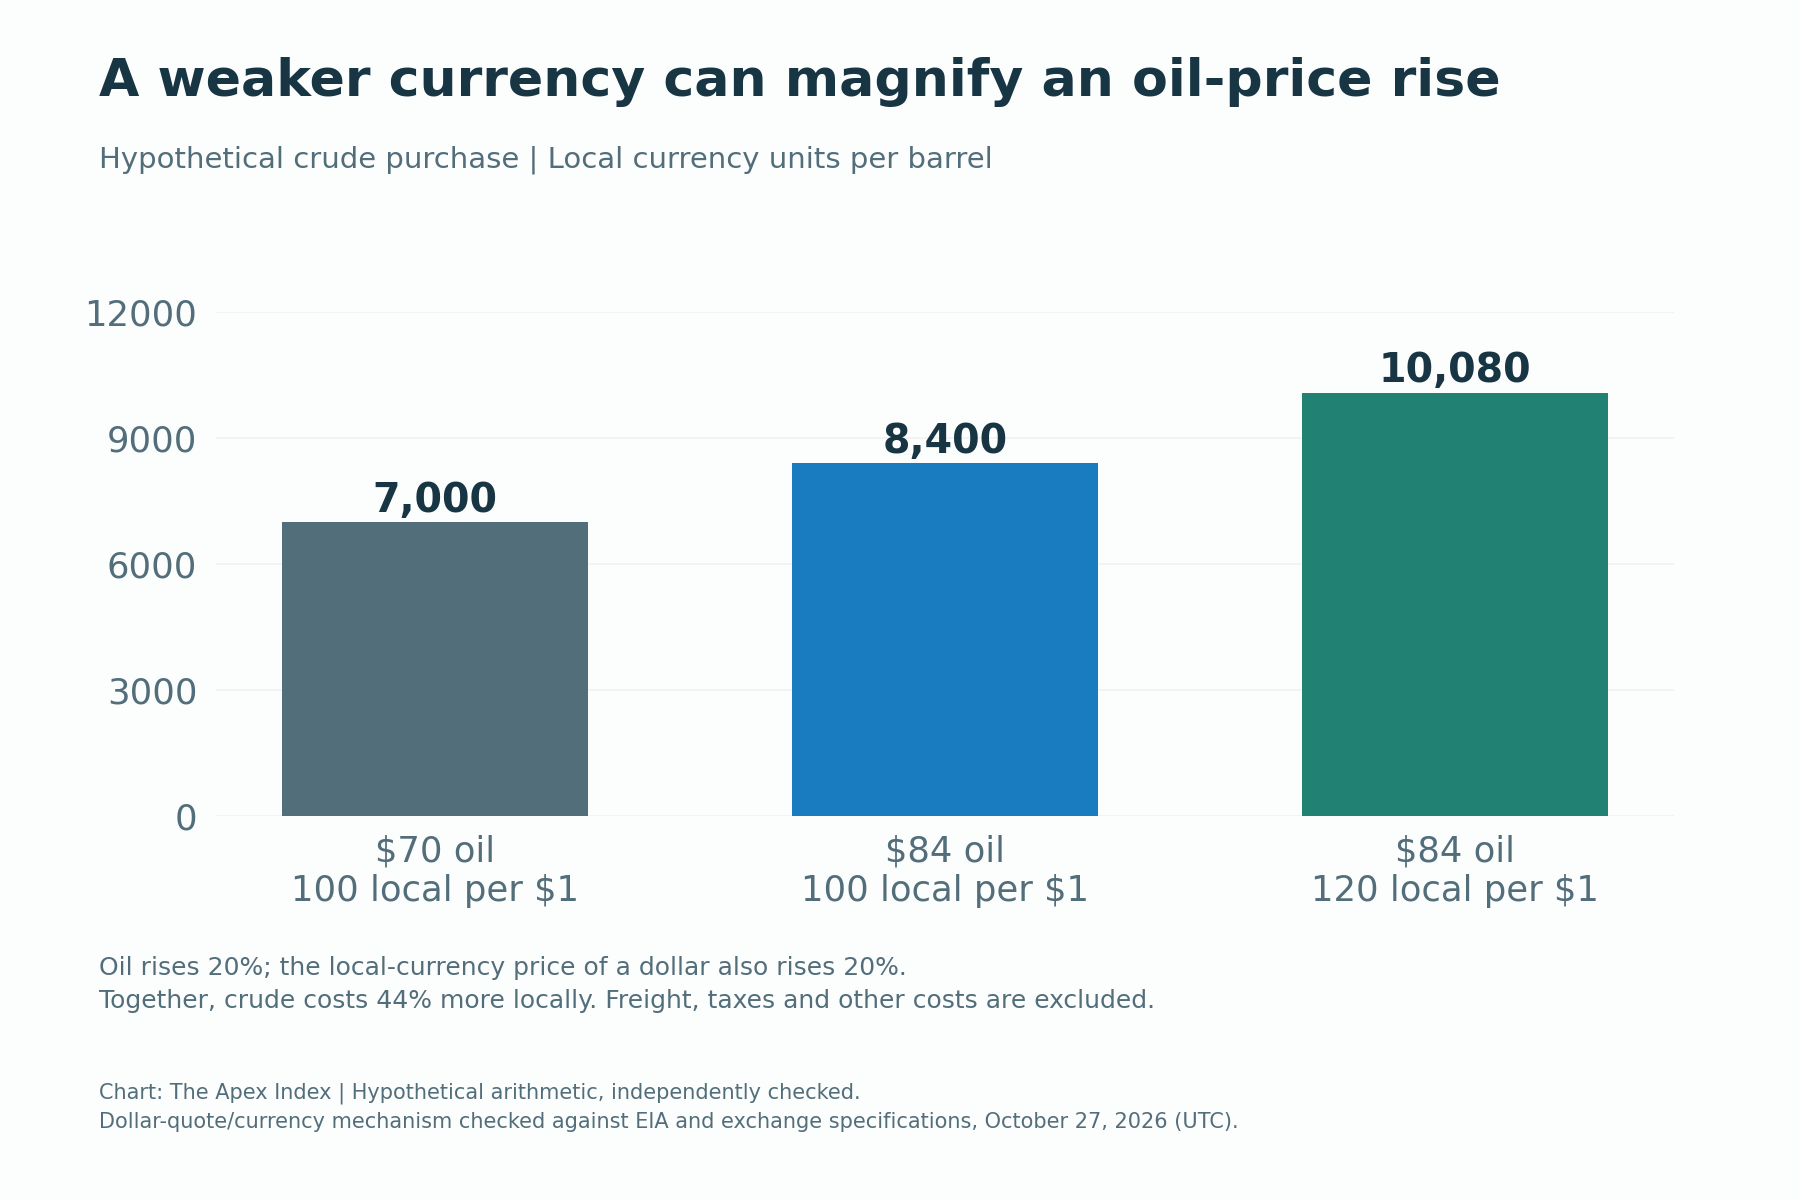
This example includes only the crude price and currency conversion. Actual import costs can include freight, insurance, financing and taxes. It illustrates why an international oil headline may understate the pressure felt by a buyer in a weakening local currency.
A crude-price move isn't the whole pump-price story
Crude oil is a major input to fuel, but motorists buy a refined product. Refineries, distribution networks and retailers add costs and margins. Taxes, subsidies, exchange rates and government pricing arrangements can change the price consumers see in different countries.
The EIA's gasoline guide separates crude costs from refining, distribution, marketing and taxes in the U.S. market. Those components don't all move in the same proportion, and their shares vary over time and between places.
A refinery outage can tighten fuel supplies even without a matching rise in crude. Transport disruption can make one region more expensive than another. Contracts and existing inventories can also affect how quickly wholesale changes reach retailers.
For households and businesses, higher fuel costs can feed into transport bills and the cost of moving goods. The wider inflation effect depends on how large and persistent the change is, how firms and consumers respond, and whether other prices or policies offset it. A single oil move cannot determine an economy's entire inflation path.
Read the next oil headline with a short checklist
Identify the benchmark, delivery month, units, timestamp and currency. Then ask what changed: actual production, a shipping route, inventory availability, demand expectations or the terms on which traders are willing to hold risk.
Compare the development with what was expected beforehand. Check whether the information concerns crude or a refined fuel, and whether the reported disruption removes supply or simply moves it to another buyer or route. Follow subsequent evidence rather than treating the first alarming headline as the final outcome.
The figures and curves in this guide are educational assumptions, not live oil prices or forecasts. Definitions and contract information were checked on October 27, 2026 (UTC). Verify current exchange specifications, product rules and market data before making an investment decision.