

A price chart can show that an asset keeps falling, that buyers have repeatedly stepped in around a certain level, or that a recent rally has lost speed. It can't tell you with certainty what happens next. Technical analysis is the attempt to turn that trading history into a useful, testable way of making decisions.
The difficult part is separating an observation from a prediction. A share price moving above its recent average is an observation. Saying it must keep rising is a prediction. Learning to read charts means understanding the information behind each signal, the conditions that could make it fail and the cost of acting on it.
What technical analysis actually studies
Technical analysis uses market data, commonly prices and trading volume, to study trends, momentum and trading patterns. Fundamental analysis asks different questions, such as what a business earns, how much debt it has and what investors are paying for its expected future cash flows. Investors can use both approaches without expecting them to answer the same question.
A company can look expensive on earnings measures while its share price continues climbing. It can also look inexpensive while its price keeps falling. A chart describes what has been happening in the market. Deciding whether the business is worth owning requires information beyond the shape of that chart.
Some chart methods are precise enough to put into rules. Others depend heavily on the person drawing the lines. If two readers can look at the same history and disagree about the pattern, define exactly what you mean before testing whether the pattern has been useful.
Start with the instrument and timeframe
Before interpreting anything, check what the chart represents. A company share, an exchange-traded fund, a futures contract and a cryptocurrency can have different trading hours, costs and sources of price data. Make sure the currency and units match the investment you're considering.
Next, choose a timeframe that fits your question. A five-minute chart helps describe intraday moves. A weekly chart compresses much more history into each bar. An asset can be rising over several months while falling over the most recent afternoon; those observations can both be correct.
A candlestick summarizes the open, high, low and close for its chosen interval. The body connects the opening and closing prices, while the wicks mark the range. Color conventions vary between platforms. A large candle shows a large move within that interval, but its appearance alone doesn't explain the cause.
Read the trend before adding indicators
A sequence of higher highs and higher lows is commonly read as an uptrend. Lower highs and lower lows describe a downtrend. A sideways range has repeated movement between areas without sustained progress in either direction.
Those descriptions depend on the period and the swings you choose. A long-term uptrend can contain a sharp correction. Zooming in until you find a favorable-looking pattern changes the question rather than resolving it. Keep the original timeframe visible when making comparisons.
Trend lines connect selected highs or lows. They can help organize a chart, but their position depends on your choices. Decide whether you use closing prices or intraday extremes and how many points must support the line. Redrawing it after every unfavorable move makes the method difficult to evaluate honestly.
Support and resistance are areas to watch
Support describes an area where a decline has previously met enough buying to slow or reverse. Resistance describes an area where an advance has struggled. Traders watch these zones because earlier transactions and repeated reactions may influence subsequent decisions.
Neither is a physical floor or ceiling. New information, forced selling or a change in demand can overwhelm the earlier pattern. Treating a support level as a guaranteed minimum price is particularly dangerous when there is little trading activity available to absorb orders.
A breakout means price has moved beyond a selected area. You still need a rule for what counts: an intraday touch, a closing price beyond it, or a sustained move with additional evidence. Each definition creates different entries and failures. Choose it before seeing whether the trade would have worked.
The last trade may not be your trading price
A chart commonly plots completed trades or a selected price feed. The last transaction is a historical observation, even when it happened only a moment ago. The price available for your next order depends on current buyers and sellers.
The bid is the quoted buying price and the ask is the quoted selling price. Their difference is the spread. A market purchase generally interacts with available offers, while a market sale interacts with available bids. An order larger than the quantity available at the best quote can execute across several prices.
That matters when testing a chart signal. Entering and leaving at the same displayed last price can hide the spread and available depth. Check whether your chart, simulator and proposed orders use consistent price data and realistic execution assumptions.
Moving averages smooth prices and introduce delay
A simple moving average, or SMA, is the arithmetic average of prices over a chosen number of periods. A five-session average of daily closing prices adds the latest five closes and divides by five. On the next session, the oldest close drops out and the newest enters.
Fidelity's indicator guide explains the tradeoff: longer averages produce smoother lines but lag the underlying prices more. An exponential moving average gives greater weight to recent observations, so it reacts differently from an equally long simple average.
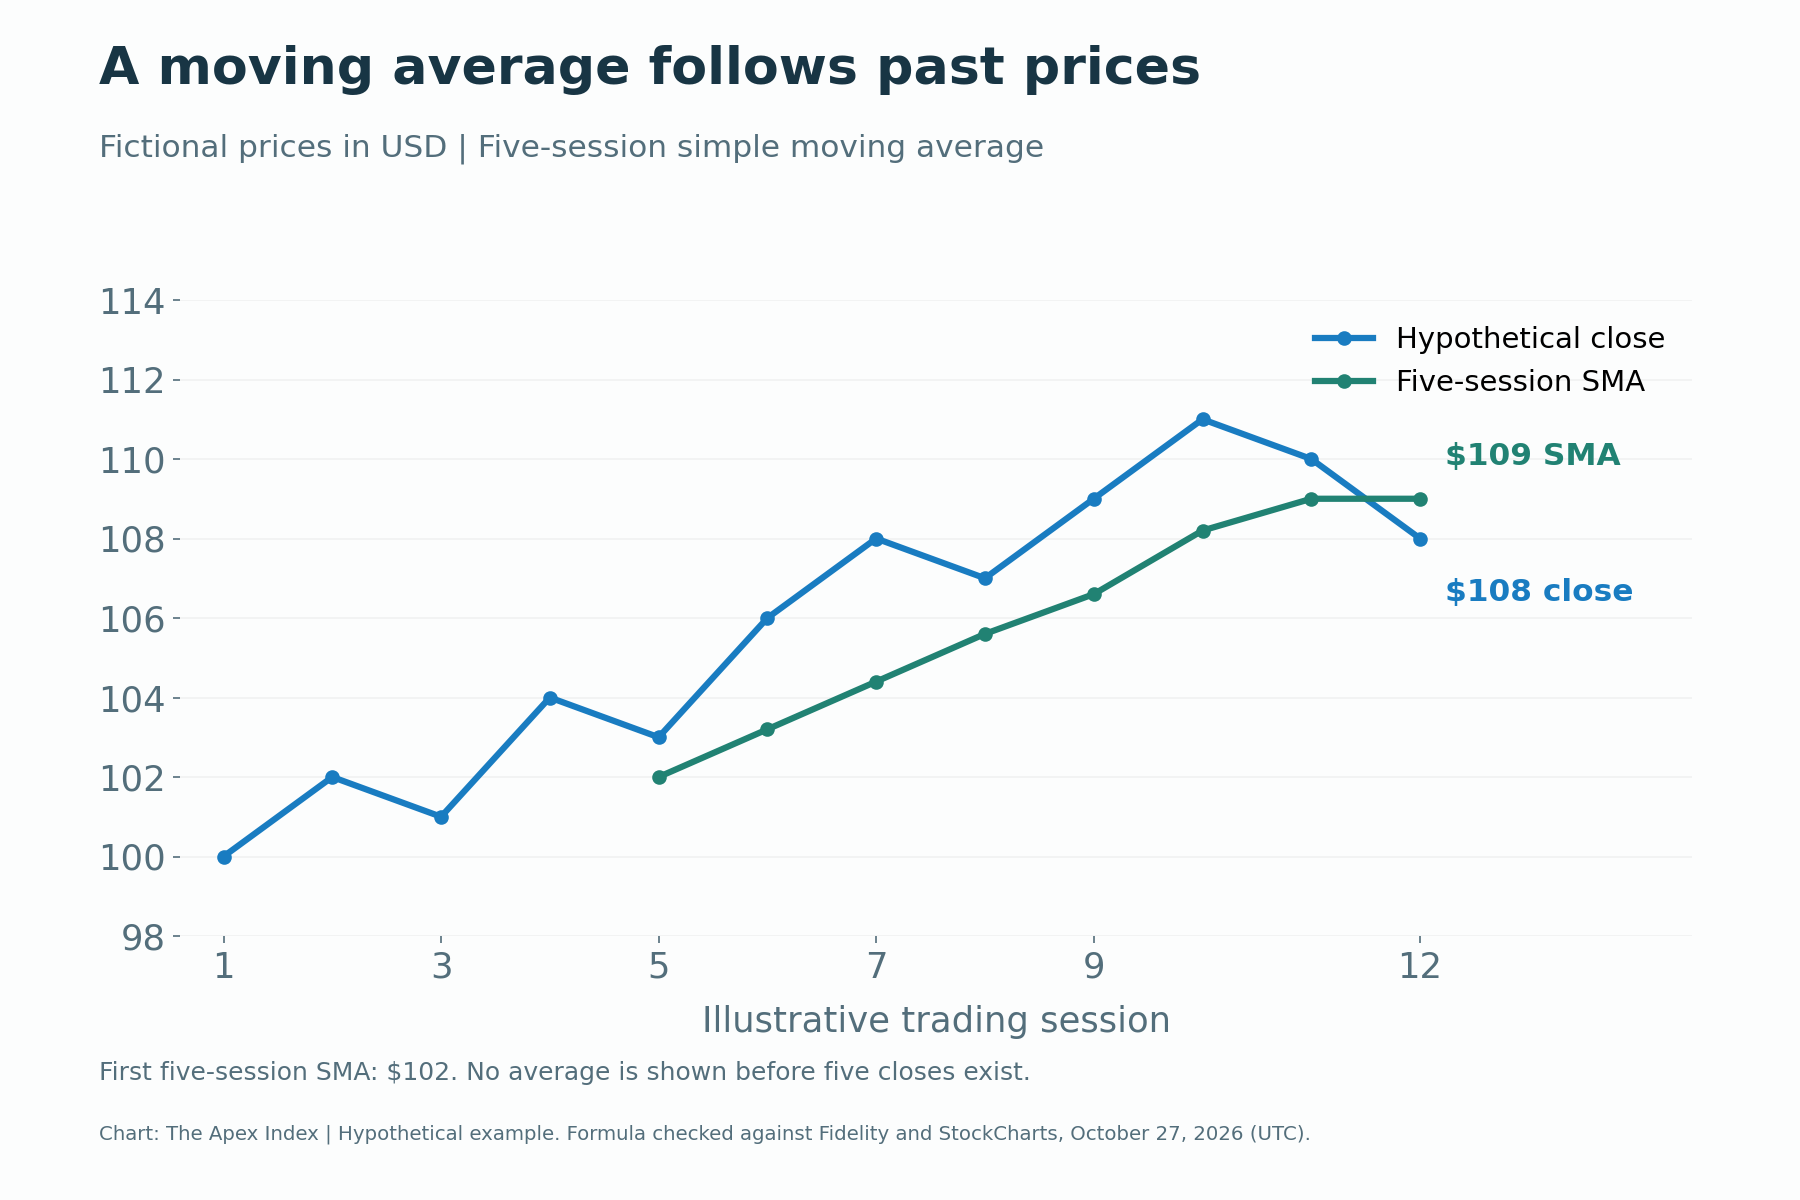
The chart uses a fictional series, not a real security or a forecast. Its first five closes are $100, $102, $101, $104 and $103, giving a five-session SMA of $102. By the final session, the latest five closes average $109, while the price has fallen to $108.
That final reading tells you where price sits relative to its recent history. It doesn't establish the probability of a rebound or further decline. Likewise, a short average crossing a longer one summarizes a relationship between past prices; it is not independent evidence about future earnings or demand.
Momentum measures the pace of the move
The Relative Strength Index, or RSI, compares the size of recent upward and downward price changes and expresses the result on a scale from zero to 100. It is a momentum measure. A commonly used setting is 14 periods, with traditional reference levels of 70 and 30.
Values above 70 are often called overbought, while readings below 30 are called oversold. Those words describe the indicator, not a command to sell or buy. A strong trend can keep RSI in either area for an extended period. The calculation and smoothing convention also need to match when comparing platforms.
A divergence occurs when price makes a new extreme that the indicator doesn't confirm. It can be a reason to investigate weakening momentum, but it doesn't guarantee a reversal or specify when one will happen. Several indicators built from the same price series can repeat similar information rather than provide several independent confirmations.
Volume and volatility answer different questions
Volume measures trading activity over a period. A move accompanied by unusually heavy volume can attract more attention than one occurring with little activity. Compare it with an appropriate baseline, keeping the trading session and data source consistent.
High volume does not mean everyone is buying without anyone selling. Every completed trade has both sides. Price changes reflect the terms at which participants are willing and able to transact, while volume records the activity. It doesn't reveal every participant's motive or investment horizon.
Volatility concerns how much prices move. Average True Range, or ATR, incorporates the current high-low range and gaps from the previous close, then averages those true ranges. A higher ATR indicates larger recent ranges; it doesn't say whether the next move will be up or down.
An asset whose normal daily range is large may cross a tightly placed stop repeatedly without changing its longer-term trend. Using volatility to plan a trade can help put that distance in context. It still cannot make the exit price certain.
A useful setup includes a way to be wrong
A chart-based plan should identify the entry condition, the development that would undermine the idea and the amount of capital exposed. Buying because a line looks attractive leaves those decisions to be made after money is already at risk.
Consider a hypothetical purchase at $100, with a planned exit if the price reaches $95. The intended price risk is $5 a share. If someone chooses a $100 planned loss budget, that arithmetic allows 20 shares before fees and execution differences. It is an illustration of position sizing, not a recommended trade or risk limit.
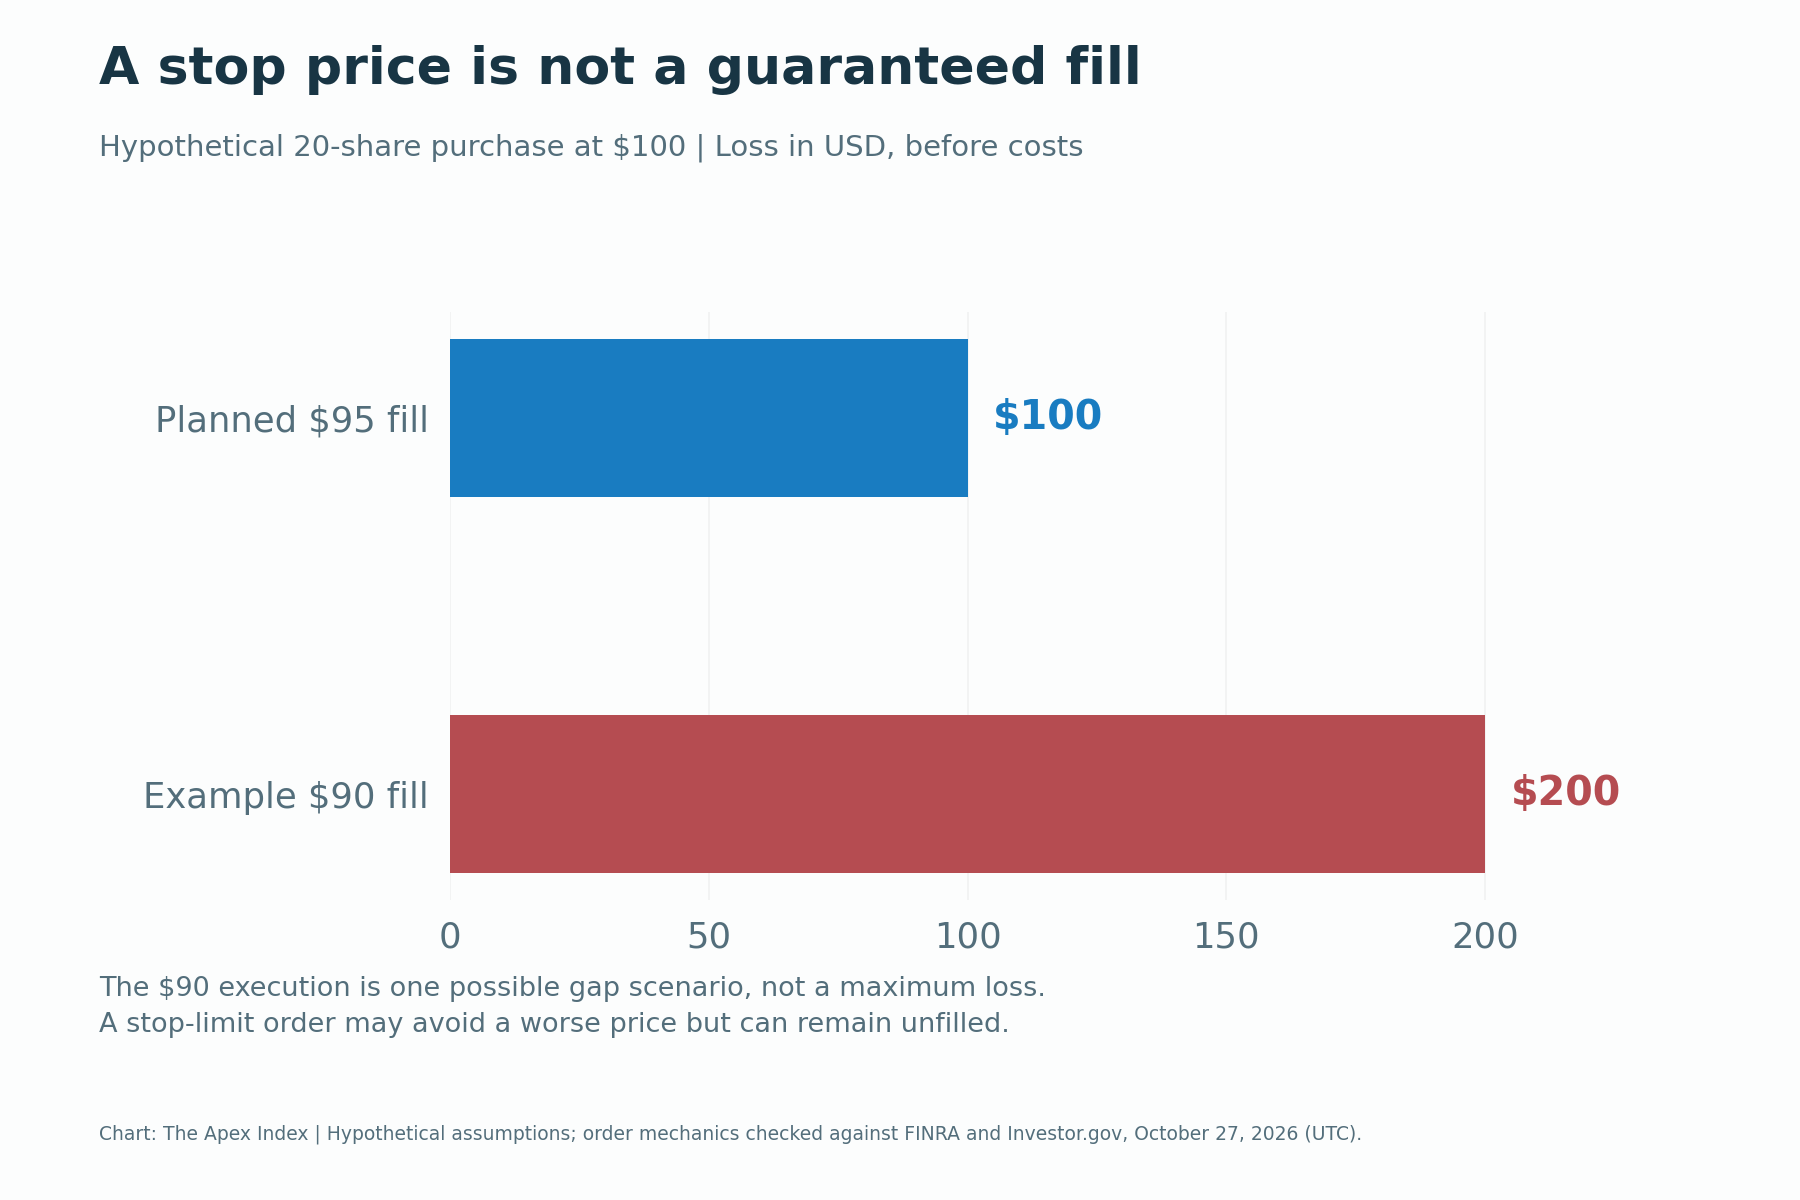
A stop order doesn't guarantee a sale at $95. If the next available execution is $90, the loss on those 20 shares would be $200 before costs. The chart separates the intended loss from that possible gap scenario, so the plan isn't mistaken for a promise.
In its U.S. stock-market warning, FINRA explains that a triggered stop becomes a market order and can execute far from the stop price. A stop-limit order adds a price constraint but may not execute. Broker rules, market hours and order support differ across venues and countries, so check the actual product's terms.
Does technical analysis work?
The answer depends on the rule, the market, the period and the meaning of "work." Describing a past pattern accurately, adding statistical information and producing a profitable trading strategy after costs are different tests.
In a historical study, Andrew Lo, Harry Mamaysky and Jiang Wang applied automated pattern recognition to U.S. stock data from 1962 to 1996. They found that several indicators provided incremental information in that sample. The result does not establish that every familiar chart pattern will earn a profit in today's markets.
A method needs rules clear enough to apply before the outcome is known. Include spreads, commissions, financing and other applicable costs. A strategy that appears profitable using perfect execution at a displayed price may disappoint when actual orders must compete for liquidity.
Also look beyond its winning trades. Ask how many opportunities it tested, how large the losses were, how long the worst decline lasted and how much money remained tied up. A high success rate can coexist with poor overall results if occasional losses are much larger than the gains.
Backtests need a fair test
A backtest applies rules to historical data. It can help identify obvious problems and compare approaches, but it is vulnerable to choices that make the past look easier than it was.
Look-ahead bias uses information that wouldn't have been available at the decision time. For example, a signal calculated from a session's closing price cannot automatically assume execution at that same close. The assumed order timing and available price must make sense together.
Survivorship bias can arise when a test includes only assets that still exist, leaving out failures or delistings. Repeatedly adjusting settings until a strategy fits one dataset creates another problem: the apparent edge may be tailored to historical noise rather than a repeatable relationship.
Reserve data that wasn't used to choose the rules, then test those rules without quietly changing them. Examine different market conditions and keep a record of unsuccessful versions, too. A result that disappears after realistic costs or a modest change in assumptions needs more work before anyone trusts it with money.
Build a chart-reading routine you can repeat
Start by checking the instrument, units and timeframe. Describe the trend and the levels that matter to your question. Add only the indicators needed to investigate momentum, activity or volatility, and be able to explain what each one measures in plain language.
Write the conditions that would support the idea and those that would invalidate it. Check scheduled events that could overwhelm a chart pattern, such as earnings, a central-bank decision or a major announcement. A technical setup doesn't cancel the need to understand what you own.
Keep a dated record of the original setup, the intended execution and what actually happened. That makes it harder to replace a failed forecast with a more flattering story afterward, and gives you something concrete to improve.
This guide uses hypothetical prices and general educational examples, not recommendations or current market signals. Indicator definitions and the cited order guidance were checked on October 27, 2026 (UTC); check your provider's current settings and execution rules before acting.