
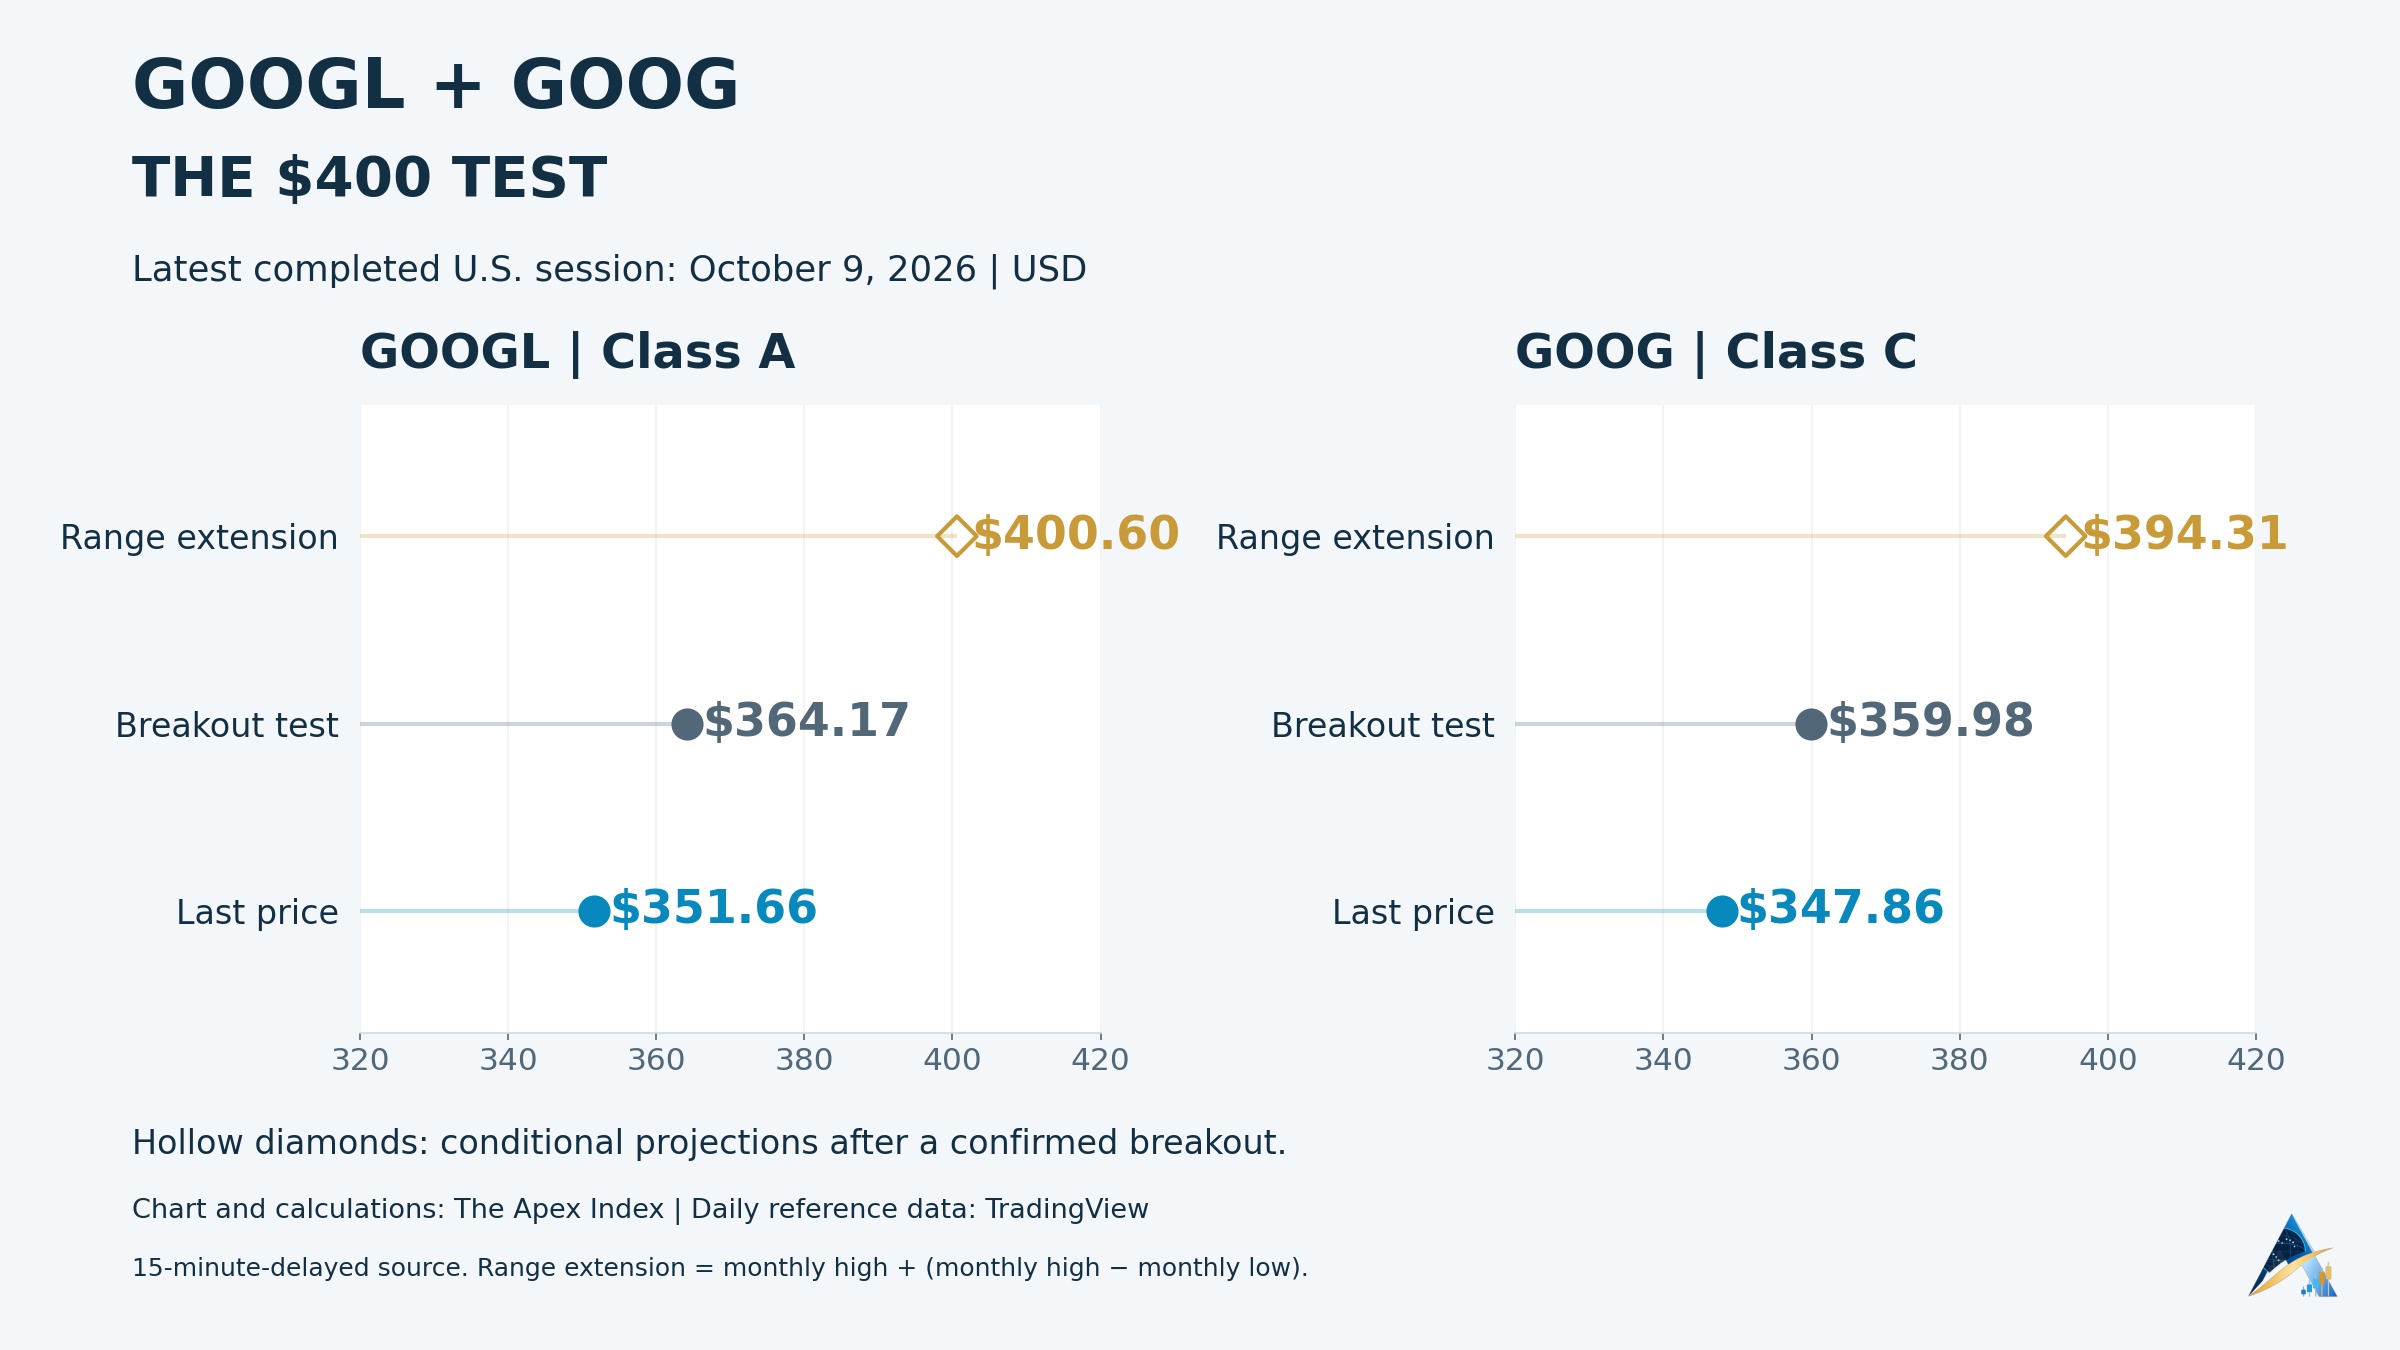
GOOGL has a credible route back toward $400 before the end of 2026, but the next confirmation sits considerably lower, at $364.17. Alphabet’s Class A shares finished the latest completed U.S. session at $351.66. The recovery has restored price above its major daily averages without yet clearing the ceiling of its one-month range. That leaves a constructive setup with unfinished business.
GOOG, the Class C line, closed at $347.86 and faces its own breakout test at $359.98. Its corresponding range extension is approximately $394.31. Both shares offer exposure to the same operating business, but neither target is a guaranteed December closing price. The fundamental question is whether accelerating AI revenue can justify Alphabet’s much heavier investment bill.
What the latest market data actually says
This analysis uses the completed October 9 cash-market session, checked against Apex’s market feed on October 10. The underlying quote service carries a 15-minute delay. Saturday’s observation is a retrieval of Friday’s market data, rather than evidence of a new weekend trading session. Technical readings and scenario distances use the same dated prices throughout.
The technical reference points come from TradingView’s daily indicators and rolling high-low fields. The charts show those observed levels, reported rolling returns and explicitly conditional projections. They do not reconstruct a candle history from isolated quotes. A moving average supplies a trend reference; a historical range supplies a boundary. Neither establishes a probability that price will reach a particular destination.
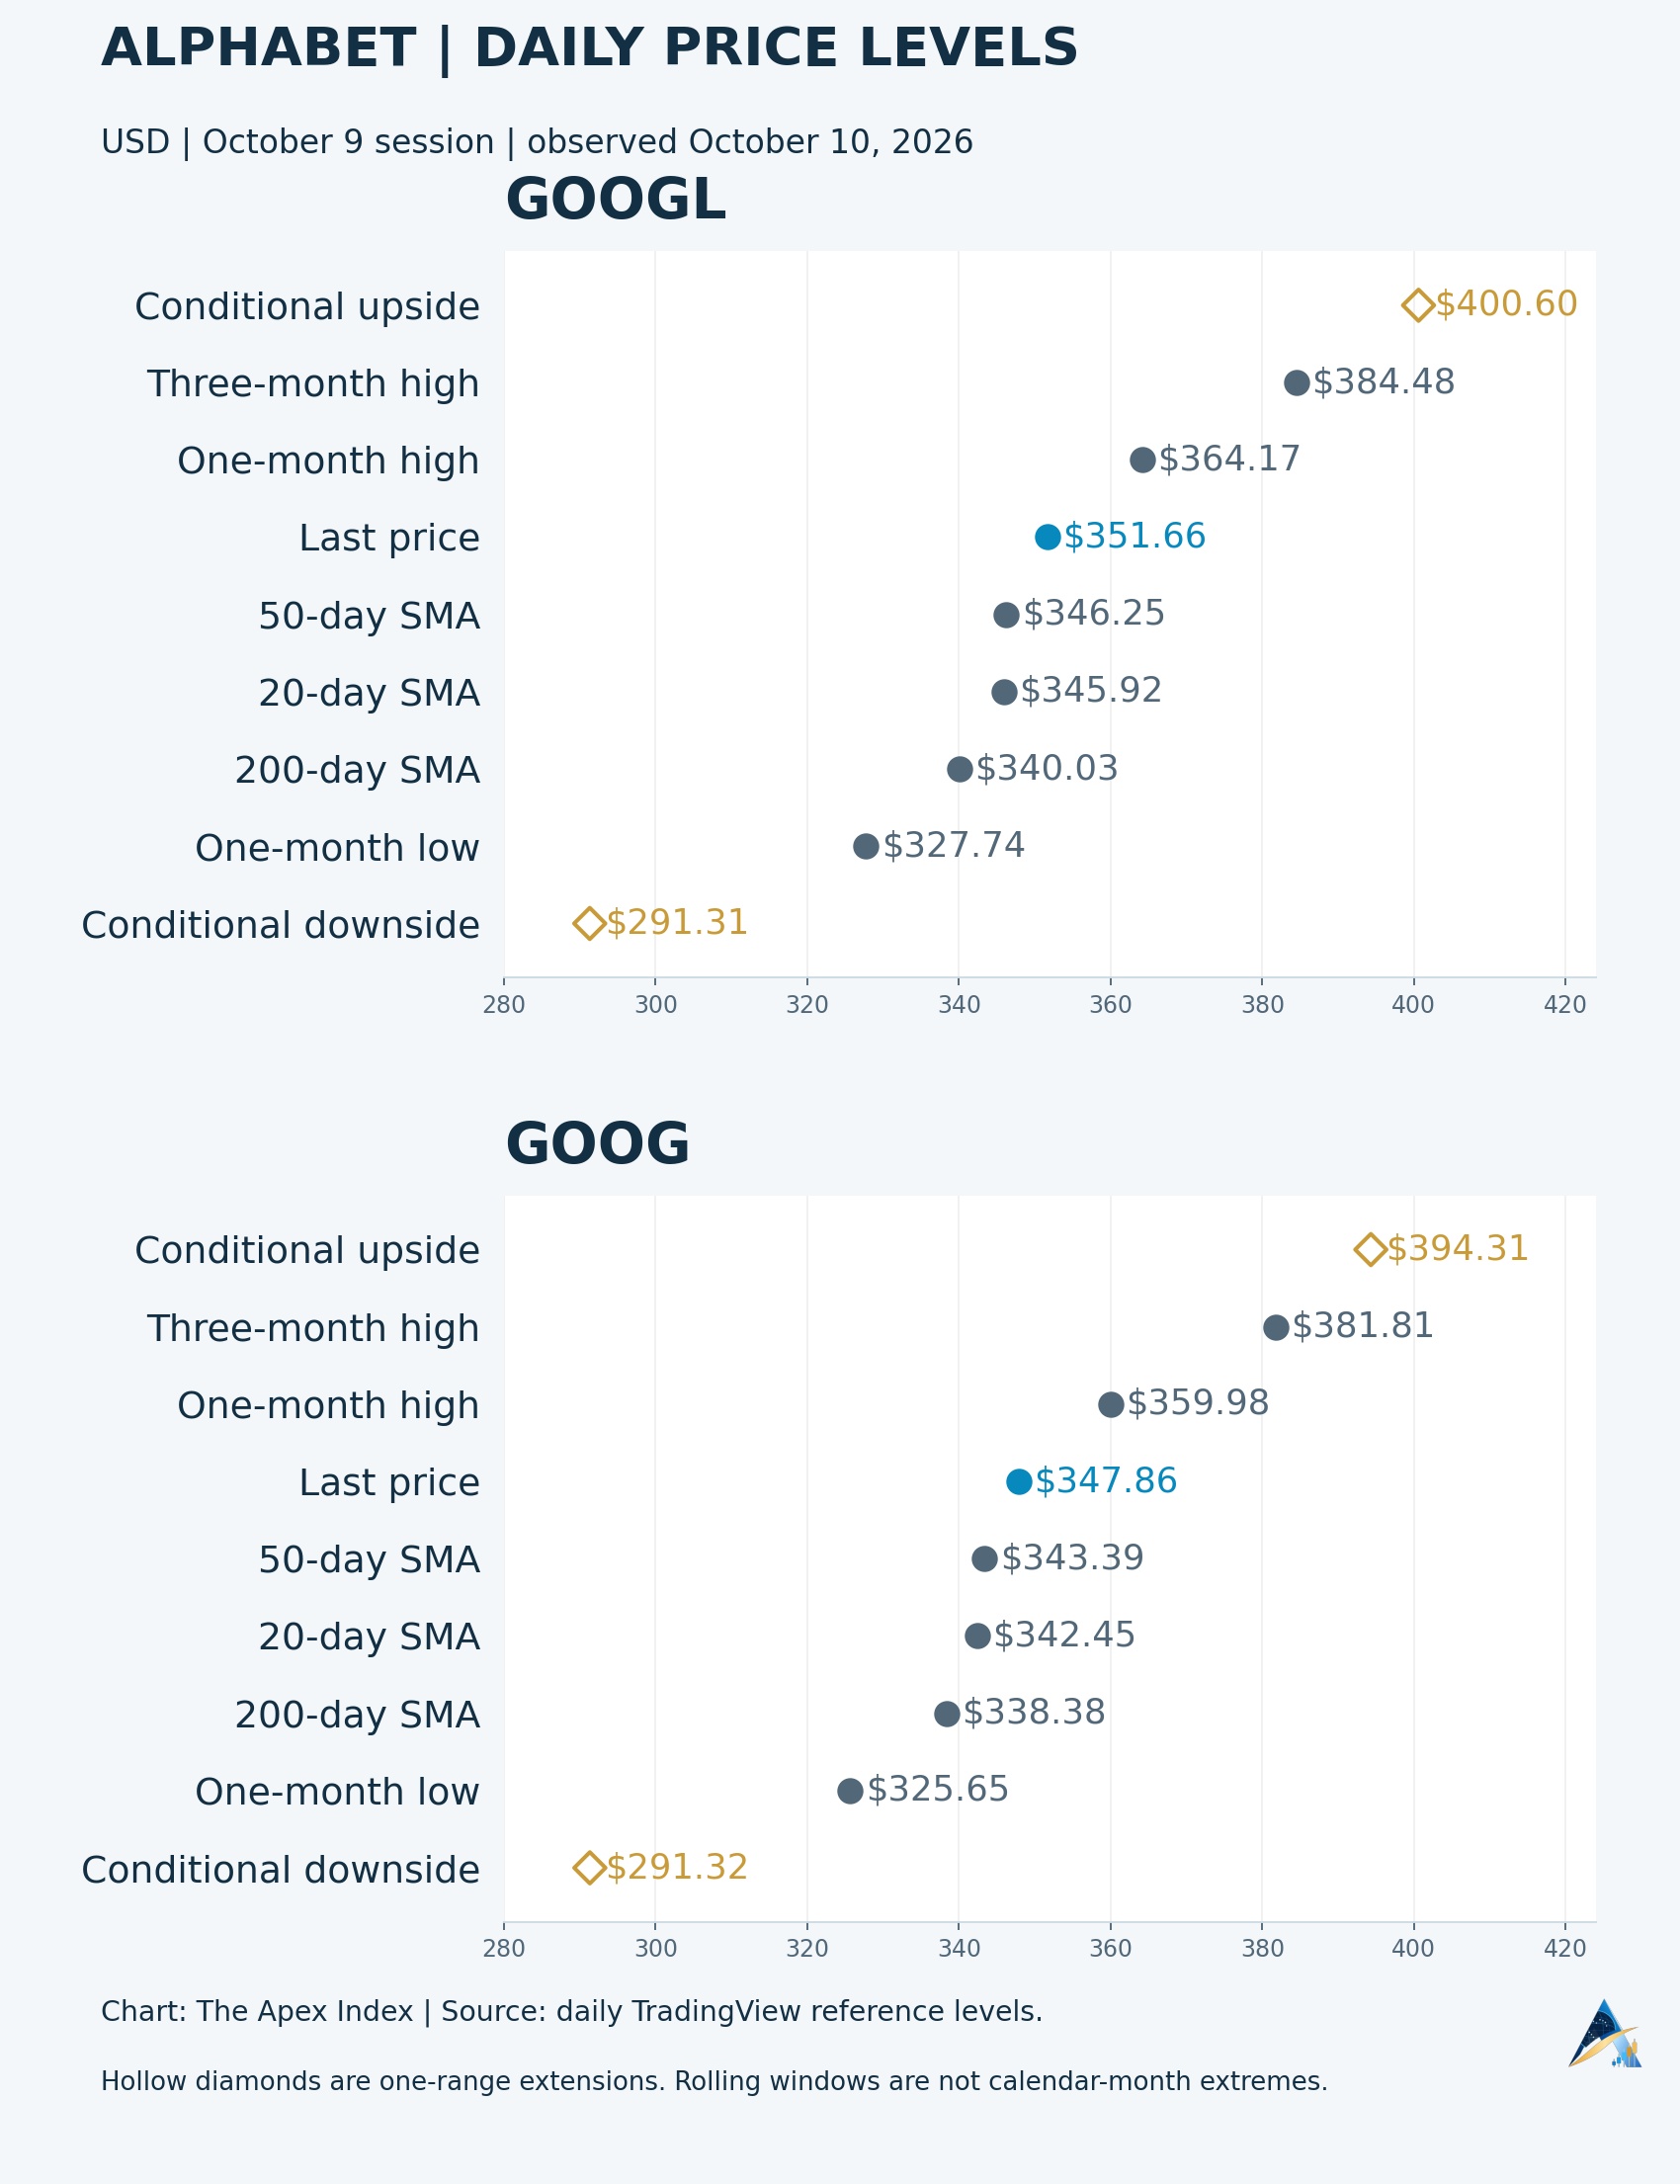
GOOGL’s one-month range spans $327.74 to $364.17, a width of $36.43. GOOG’s spans $325.651 to $359.98, a width of $34.329. Those differences are small economically but material when setting an entry or invalidation level. Applying GOOGL’s resistance directly to a GOOG position would mean trading the wrong instrument’s chart.
Two share classes, one business risk
GOOGL is Class A stock; GOOG is Class C. The familiar distinction is voting rights: Class A carries one vote per share, while Class C is nonvoting. Both participate in Alphabet’s economic performance, and the company declared the same $0.22 common quarterly dividend across its three common share classes in its latest quarterly release.
At the reference closes, GOOGL trades about 1.09% above GOOG. That premium can matter to an investor choosing between otherwise closely related exposures, but it is not a guaranteed arbitrage return. The spread can persist, widen or narrow. Trading costs, taxes, liquidity and the value an investor places on voting rights all affect the practical choice.
Owning both does little to diversify the central investment thesis. Search monetization, Cloud demand, infrastructure spending and management’s capital allocation still determine the same company’s earnings. Nor should the roughly $4.28 trillion issuer market capitalization be counted twice because a data page displays it against each ticker. Separate technical setups do not create separate underlying businesses.
GOOGL’s trend is improving, with an important qualification
The daily 20-day simple moving average is $345.92, the 50-day average $346.25 and the 200-day average $340.03. Price above all three supports a recovery interpretation. The tight $345.92–$346.25 cluster is the first area where a pullback could test whether recent buyers are willing to defend the move.
However, the 20-day average remains slightly below the 50-day average. That is not a perfectly ordered bullish trend stack. It is also insufficient evidence to announce a fresh golden cross or claim that every average is rising. The available readings establish where price sits relative to the averages; they do not, by themselves, establish the full historical sequence of crossings.
The 200-day line near $340 provides the next longer-term reference if the shorter cluster fails. Losing it would damage the recovery, although a single intraday excursion would carry less weight than repeated closes below it. The one-month floor at $327.74 remains the more consequential boundary for the deeper downside scenario.
GOOG requires its own confirmation
GOOG’s 20-day and 50-day averages sit at $342.45 and $343.39, with its 200-day average at $338.38. Here too, price has recovered above all three while the shortest average remains below the intermediate one. A retreat toward $342–$343 would test the immediate trend structure; a sustained loss of $338.38 would raise the importance of the monthly floor.
The nearest range ceiling is $359.98, approximately 3.5% above the reference close. Beyond that, the three-month high at $381.81 offers a historical supply reference before the measured extension at $394.31. Neither the lower share price nor the slightly different indicator readings makes GOOG automatically safer than GOOGL. The underlying earnings and investment risks are shared.
The corresponding GOOGL ceiling is approximately 3.6% away. Its next historical reference is the three-month high at $384.48. These levels describe a sequence of tests, rather than an uninterrupted path upward. A stock can break an initial range, struggle at an older high and return to its breakout level without completing the full extension.
Momentum supports the bounce, but has not settled the argument
The 14-day RSI reads 56.35 for GOOGL and 55.93 for GOOG. Both sit above the neutral 50 region and below the conventional 70 overbought threshold. That supports improving daily momentum. It does not establish that buying pressure will persist through an earnings release, or that a modestly positive RSI alone can overcome overhead supply.
MACD is also constructive. GOOGL’s line is approximately 1.26 against a 0.33 signal, producing a positive histogram near 0.93. GOOG’s line is about 1.16 against a 0.20 signal, with a histogram near 0.96. Those readings support the recovery interpretation, but there is no basis here to claim a historical momentum divergence from one snapshot.
Fourteen-day average true range is $8.39 for GOOGL and $8.17 for GOOG. Ordinary realized variation is therefore meaningful relative to the distance between nearby support lines. A stop placed only a few cents beneath an average can be vulnerable to routine movement. ATR is a measure of recent range, not a guaranteed daily trading band or a year-end forecasting formula.
The rebound is stronger than the longer-term relative picture
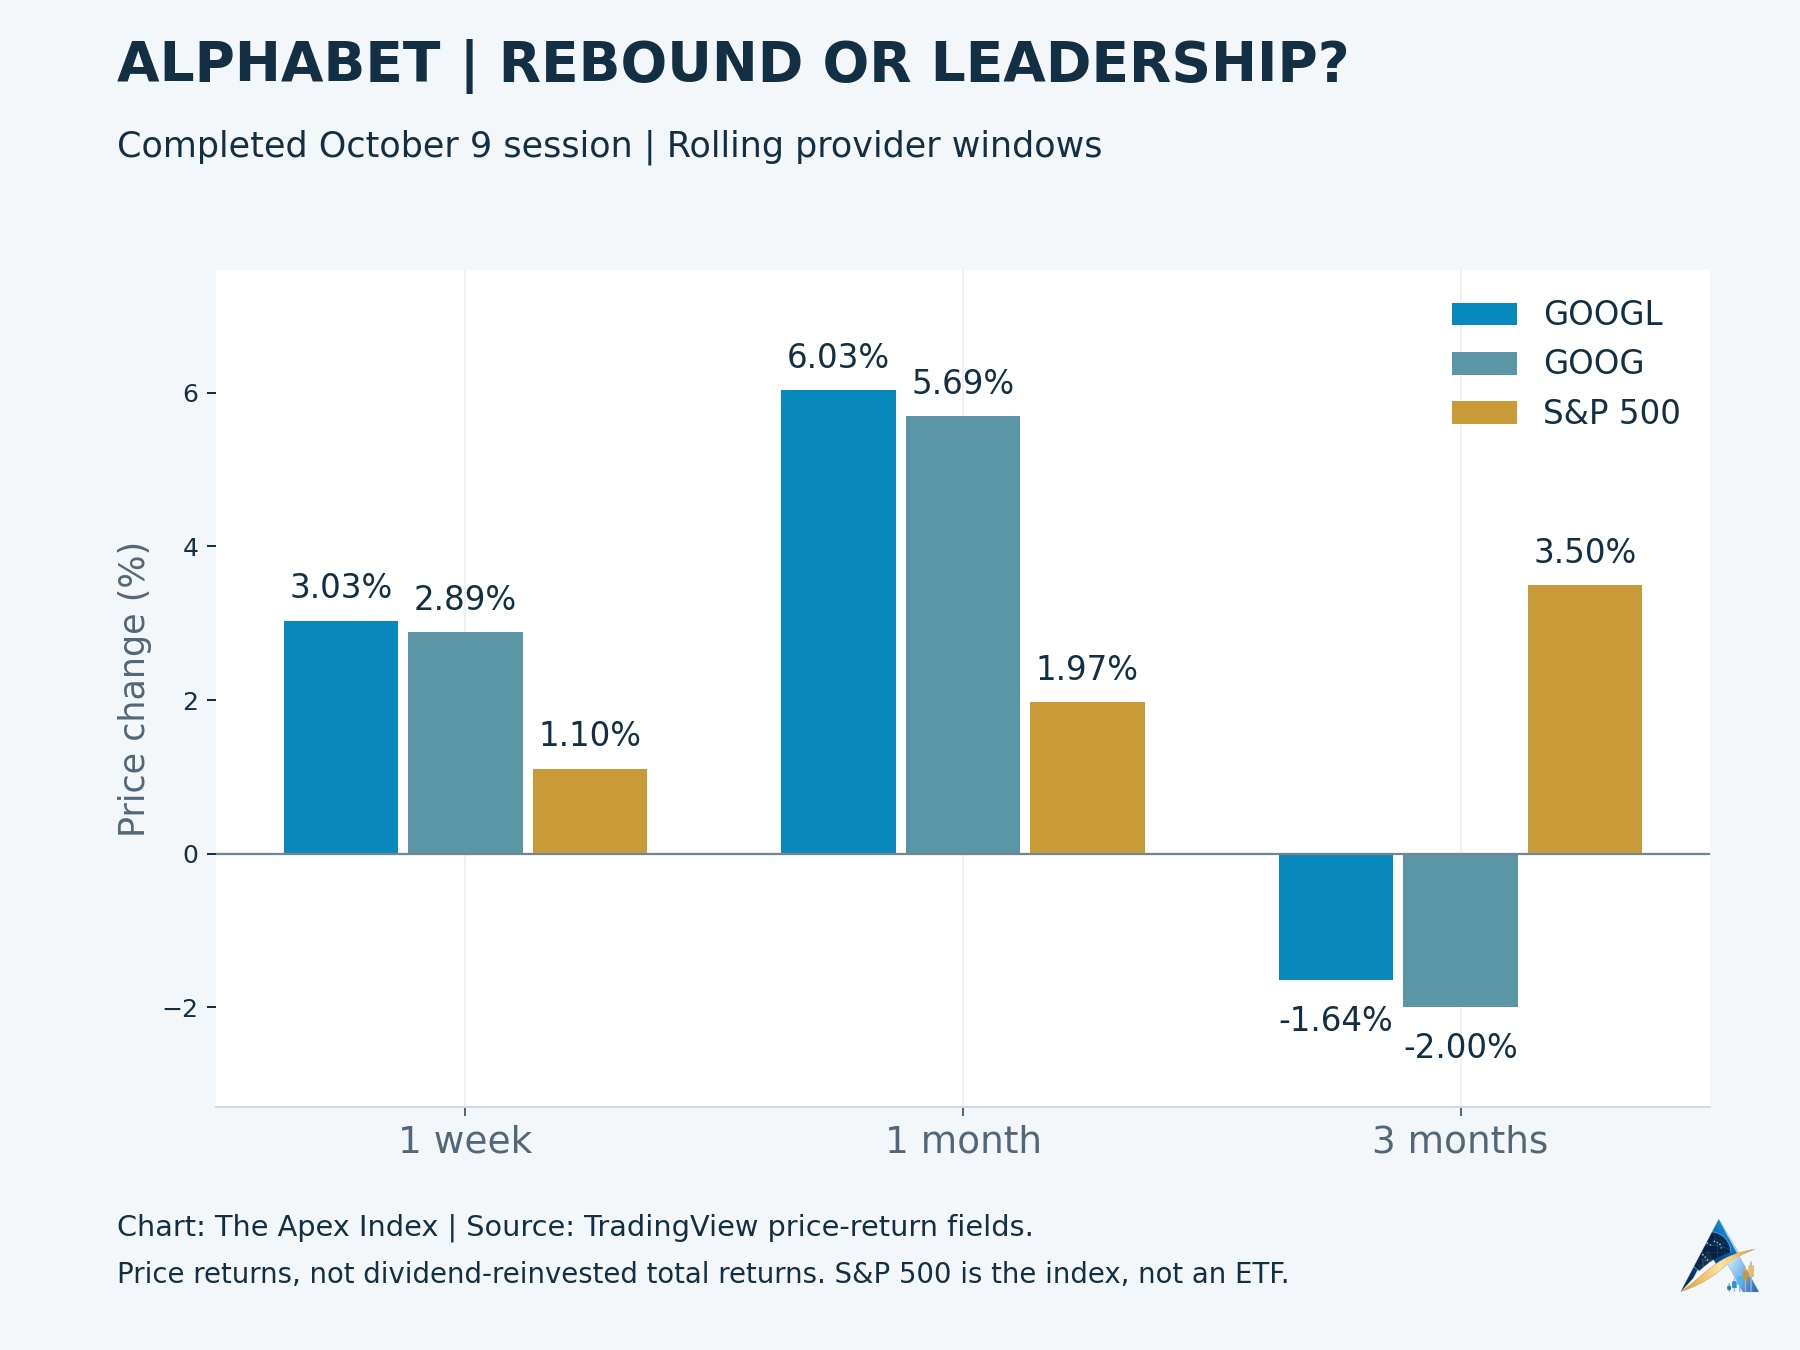
Over the provider’s rolling one-week window, GOOGL gained 3.03% and GOOG 2.89%, compared with 1.10% for the index. Over one month, their gains of 6.03% and 5.69% also exceeded the S&P 500’s 1.97%. The recent recovery is therefore more than a simple matching of the broader market’s advance.
Extend the comparison to three months and the conclusion changes. GOOGL is down 1.64% and GOOG down 2.00%, while the S&P 500 is up 3.50%. Alphabet has regained short-term relative strength without yet recovering sustained leadership across the longer comparison window. These are price returns over rolling provider windows, excluding reinvested dividends, rather than calendar-month total returns.
The bullish year-end path
A completed daily close above $364.17 for GOOGL or $359.98 for GOOG would improve the expansion case. Follow-through and a retest that holds the former ceiling would be stronger evidence than a brief move above it. The next historical tests are $384.48 and $381.81 respectively, where previous buyers could use a recovery to reduce exposure.
Adding each observed range width to its upper boundary produces $400.60 for GOOGL and $394.309 for GOOG, rounded to $394.31. Those projections are approximately 13.9% and 13.4% above the respective reference closes. They are measured moves activated by confirmed range expansion, rather than statistical confidence bounds or targets derived from an earnings valuation model.
GOOG would need to progress beyond that first extension to reclaim $400, with its six-month high at $404.47 a further historical reference. GOOGL’s comparable high is $408.61. An entry after breakout confirmation would also have less remaining upside than the percentages measured from today’s reference prices. Waiting for evidence changes the prospective reward as well as the quality of the setup.
The base case and the breakdown alternative
While price remains between the monthly boundaries, the central technical case is consolidation with an improving near-term bias. Holding the short-term averages would preserve that bias. Failing repeatedly at resistance while losing those averages would weaken it. There is no need to force a $400 forecast onto a stock still working through a roughly $330–$360 range.
The bearish path becomes more persuasive if price loses the 200-day averages and then accepts trading below $327.74 for GOOGL or $325.651 for GOOG. The three-month lows, $314.90 and $314.89, provide intermediate historical references. They could interrupt a decline before any full range extension is completed.
Subtracting each range width from its floor gives downside projections of $291.31 for GOOGL and $291.322 for GOOG, rounded to $291.32. These are approximately 17.2% and 16.3% beneath the reference closes. A rapid recovery back inside the range would weaken the breakdown thesis; a failed reclaim would strengthen it. The trigger matters more than the apparent precision of the target.
Why the headline P/E needs a second look
The displayed trailing price-to-earnings ratios are approximately 17.67 for GOOGL and 17.48 for GOOG, using diluted trailing earnings of $19.9053 per share. Those multiples can look inexpensive for a business growing rapidly. Yet Alphabet’s July 22 release contains an unusually large complication: investment gains substantially inflated second-quarter earnings.
The quarter included $99.031 billion of net gains on equity securities. The company attributed $6.26 of its $9.11 diluted quarterly EPS to the net effect of those gains. That contribution is not equivalent to recurring profit from selling advertising or Cloud services. Annualizing the full $9.11 would give a particularly misleading picture of sustainable operating earnings.
An illustrative subtraction of that $6.26 contribution from the displayed trailing EPS leaves $13.6453. Dividing the reference prices by that denominator produces multiples of approximately 25.77 and 25.49. This is not a fully normalized earnings estimate or a forward P/E: it removes only one identified quarterly item, while other periods and adjustments remain untouched. Its purpose is to show how much the apparent valuation depends on investment accounting.
The operating business still has real momentum
Second-quarter revenue reached $119.796 billion, up 24%. Search and other revenue was $63.271 billion, up 17%, while YouTube advertising rose 13% to $11.055 billion. Those figures are historical results for the quarter ended June 30, rather than a new October announcement. They nevertheless provide the relevant operating baseline for judging the next report.
Cloud was the standout, with revenue of $24.768 billion, up 82%, and operating income of $8.814 billion. Its 35.6% operating margin showed that the expansion was not confined to sales. Alphabet’s total operating income of $40.770 billion and 34% margin give investors a more direct view of the business than the investment gains included below operating profit.
The next earnings test is whether Search continues to monetize effectively while Cloud converts demand into profitable revenue. Backlog of $514 billion indicates contracted business, but it is not cash already collected or revenue already earned. Management expected more than half to be recognized over the following 24 months. That timetable matters when comparing a long-duration demand pipeline with immediate infrastructure payments.
Cash conversion is the harder part of the thesis
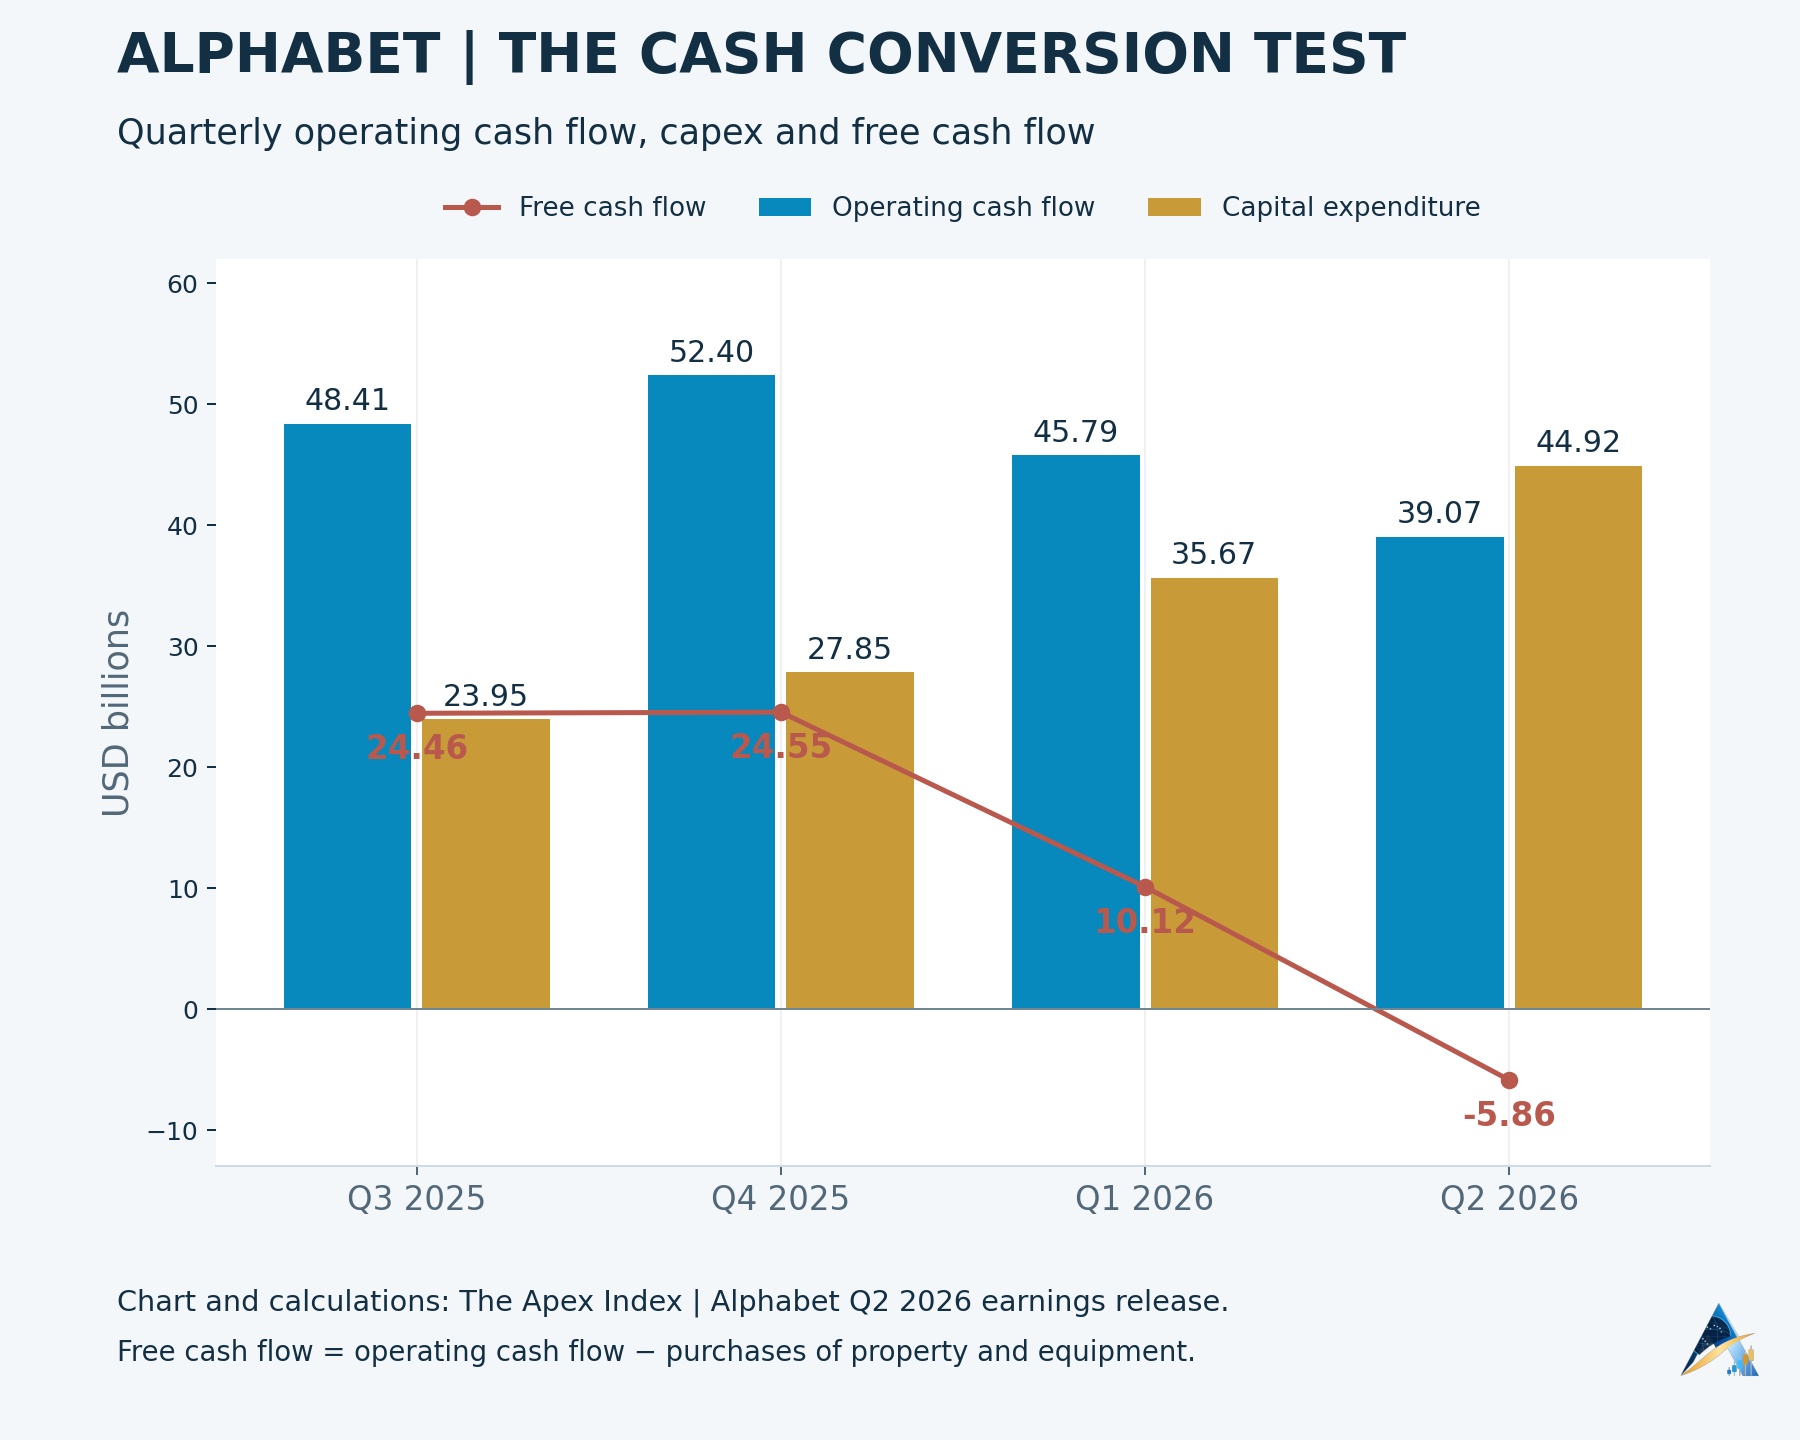
The cash-flow chart captures the tension. Quarterly free cash flow was $24.461 billion in the third quarter of 2025 and $24.551 billion in the fourth. It fell to $10.116 billion in the first quarter of 2026, then turned negative at $5.855 billion in the second. The calculation is operating cash flow minus purchases of property and equipment.
For that latest quarter, $39.069 billion of operating cash flow was outweighed by $44.924 billion of capital expenditure. This was not a collapse in operating revenue, but it was a sharp deterioration in cash left after infrastructure investment. The timing and eventual returns on those payments are central to what shareholders are buying.
Trailing twelve-month free cash flow was $53.273 billion. Against the approximately $4.28 trillion market value, that implies a historical free-cash-flow yield near 1.24%. It is a backward-looking measure during an unusually heavy investment cycle, rather than a steady-state yield forecast. Still, it shows why a low reported P/E cannot settle the valuation question on its own.
AI growth has to pay for the infrastructure
On the July earnings call, management raised its 2026 capital-expenditure guidance to $195–$205 billion from $180–$190 billion. That is a full-year spending expectation, not expenditure already completed. Management also anticipated higher investment in 2027, making cash recovery dependent on monetization and capacity utilization rather than simply reaching the end of this year.
Depreciation and energy costs add another layer. Cash leaves when infrastructure is purchased, while depreciation affects earnings as assets enter service. Strong revenue growth can therefore coexist with pressure on both current cash conversion and subsequent reported margins. Management also described third-party capacity as a bridge for the third quarter, with some near-term margin pressure expected.
The commercial opportunity is substantial, but demand needs to be distinguished from unit economics. September 30’s Argon announcement described Gemini 4 capabilities in coding, enterprise work and cybersecurity, initially involving trusted defenders and testers before broader access. Better model performance can attract usage; it does not, by itself, establish profitable revenue growth after inference costs and introductory pricing.
As previously reported by Apex, semiconductor imports rose sharply as infrastructure demand expanded. That broader spending cycle helps explain the pressure to secure capacity, although aggregate chip imports cannot be treated as Alphabet’s own expenditure. The stock thesis depends on this company’s returns on investment, rather than the size of the industry’s spending headlines.
Capital allocation and the decision from here
June’s financing included common stock and mandatory convertible preferred stock with combined net proceeds of $49.6 billion. A separate at-the-market program authorized up to $40 billion of common stock sales, primarily for employee-equity tax obligations, but no shares had been sold under it as of June 30. Authorization should not be confused with completed issuance or its maximum future dilution.
The quarterly statement also recorded no common share repurchases in the second quarter. That dated fact does not establish what happened after June, but it does mean investors should avoid assuming that buybacks automatically offset new issuance. Future per-share growth depends on operating results, financing terms and the evolving share count together.
For traders, the immediate decision is whether the $364.17 and $359.98 ceilings become support. For longer-term holders, the more demanding test is whether Cloud growth and Search monetization restore cash generation after capital expenditure without sacrificing returns. An earnings gap can jump across a planned stop, so a well-defined technical invalidation level does not eliminate event risk.
The current evidence supports a recovery attempt with conditional upside toward $400.60 for GOOGL and $394.31 for GOOG. It does not yet support treating those destinations as the base outcome. Confirmed breakouts would strengthen that case; sustained monthly-floor failures would instead bring the roughly $291 projections into focus. Alphabet’s next results must show whether the improving chart is being matched by improving cash economics.