

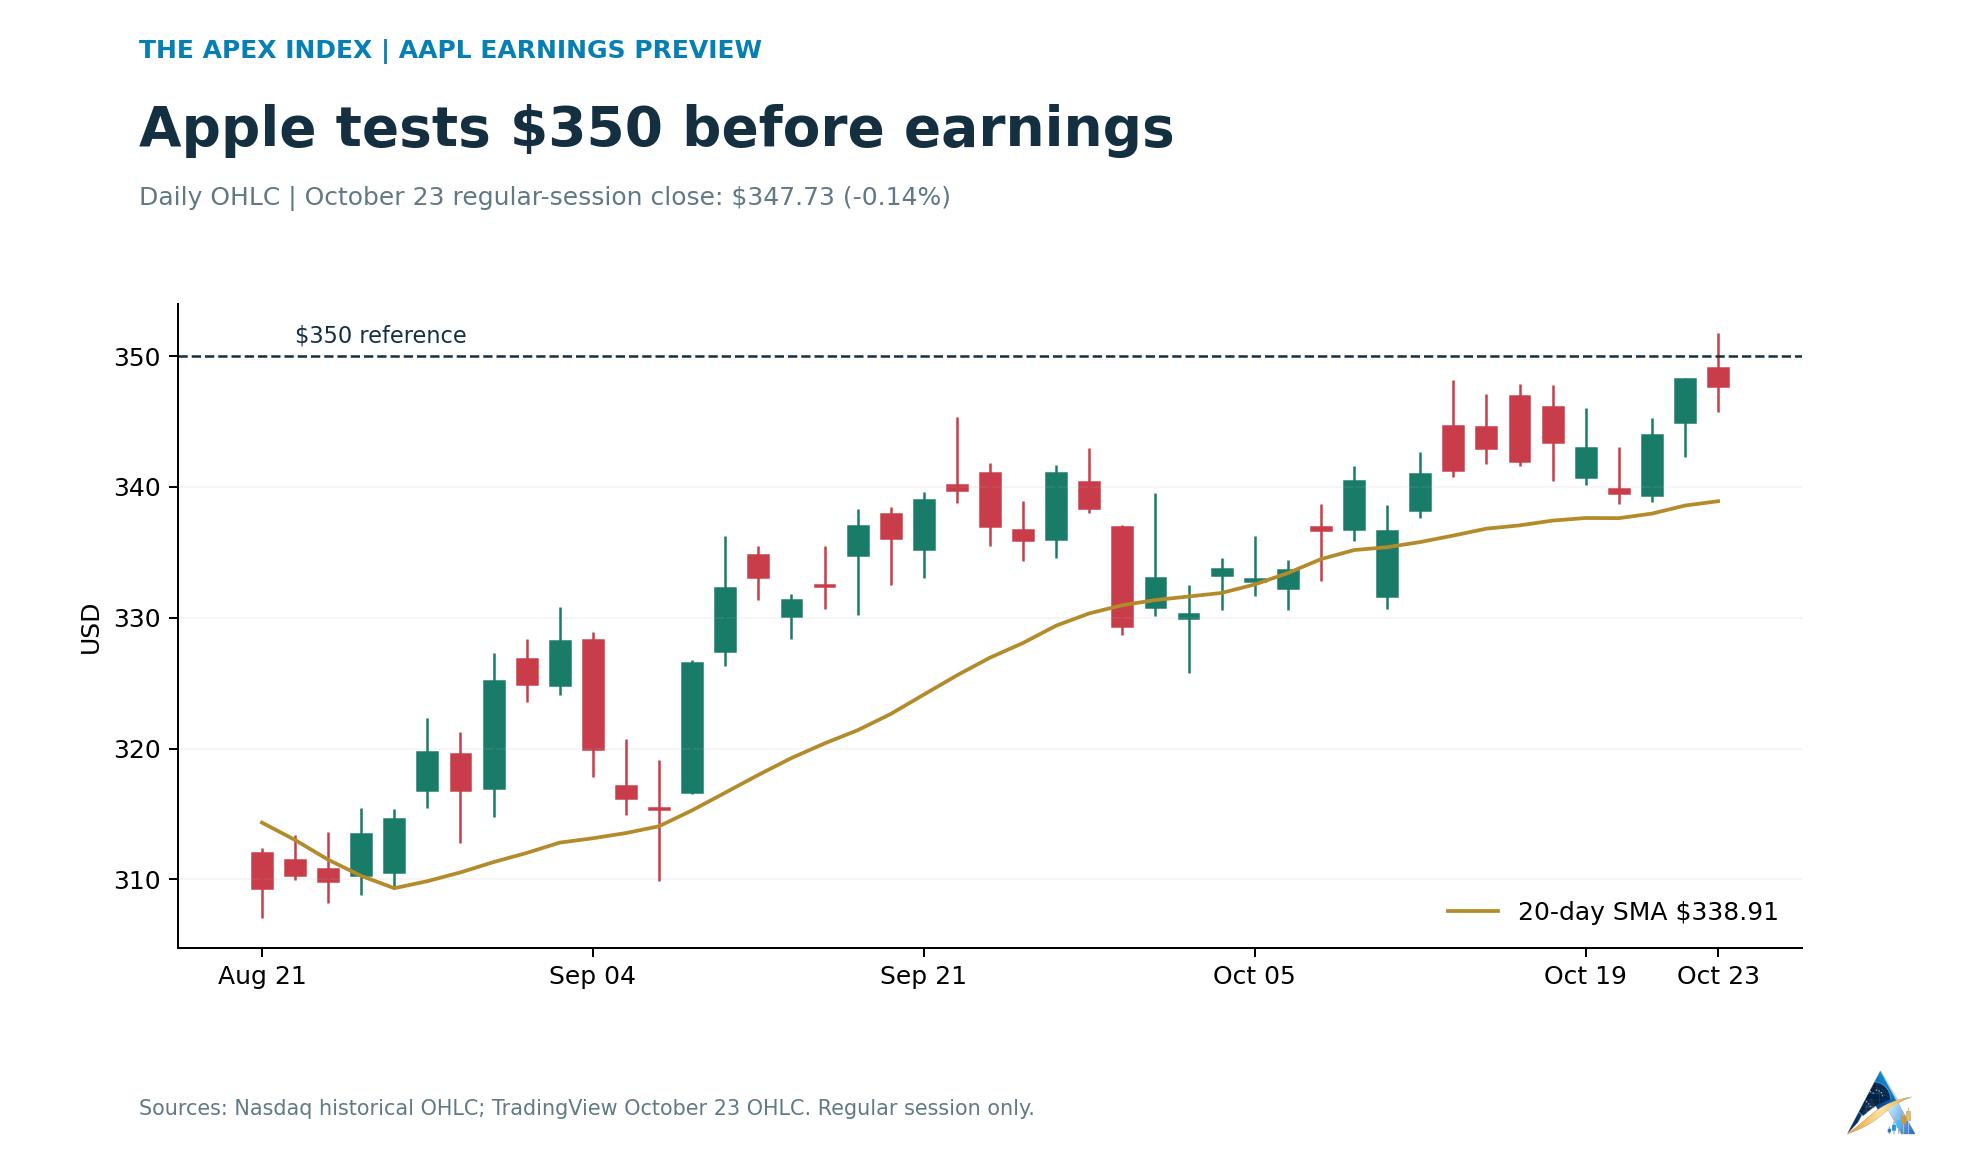
Apple has a new iPhone in stores and a familiar problem on the stock market: giving buyers enough reason to keep paying up. The first foldable iPhone, the iPhone Duo, went on sale worldwide on October 23. AAPL reached $351.73 during Friday's session, then slipped to a $347.73 close, down 0.14%.
That leaves the shares close to $350 as investors look toward fiscal fourth-quarter earnings. The company has scheduled its results call for November 2, after the closing bell. September's numbers will show how the business finished its fiscal year; management's comments about the holiday quarter will help investors judge whether the next leg of growth can justify the price.
A new iPhone, but a different quarter
Friday's launch brought the Duo to stores including Austin, New York, London, Mumbai and Shanghai. It's a fresh product to sell during the holiday shopping season, with a larger inner screen and apps built to use the extra space.
The timing matters. Those October retail sales fall in the December quarter, after the September reporting period. Investors looking for the foldable phone's retail debut to rescue the upcoming quarter are looking at the wrong set of numbers. The useful questions are how the rollout is going, whether supply can meet demand and what management expects from the broader iPhone lineup.
The home products add another reason to listen closely to the outlook. As Apex previously reported, the $299 HomeView display is scheduled to arrive November 13, while connected-home accessories have a staggered rollout beginning in December. That puts more launches into the holiday-period discussion, with revenue arriving at different times.
What investors are expecting from earnings
The Zacks consensus puts September-quarter earnings at $2.00 per share, based on eight analysts, compared with $1.85 a year earlier. That would be an increase of about 8.1%. The individual forecasts range from $1.96 to $2.09, so the consensus gives investors a reference point rather than a settled result.
For December, the same forecast table shows $2.88 per share, based on six estimates. Its fiscal 2027 consensus is $9.60 across 11 estimates. At Friday's close, the stock costs roughly 36.2 times that fiscal-year earnings forecast. A strong product launch has to earn its way into profits when investors are already paying that much for them.
The latest reported quarter provides a useful starting point. Revenue reached $109.4 billion in the three months ended June 27, up 16% from a year earlier. Diluted earnings were $2.02 per share. Tim Cook said in the July release:
"Today, Apple is proud to report our strongest June quarter ever, with double-digit revenue growth across iPhone, Mac and Services, and in every geographic segment."
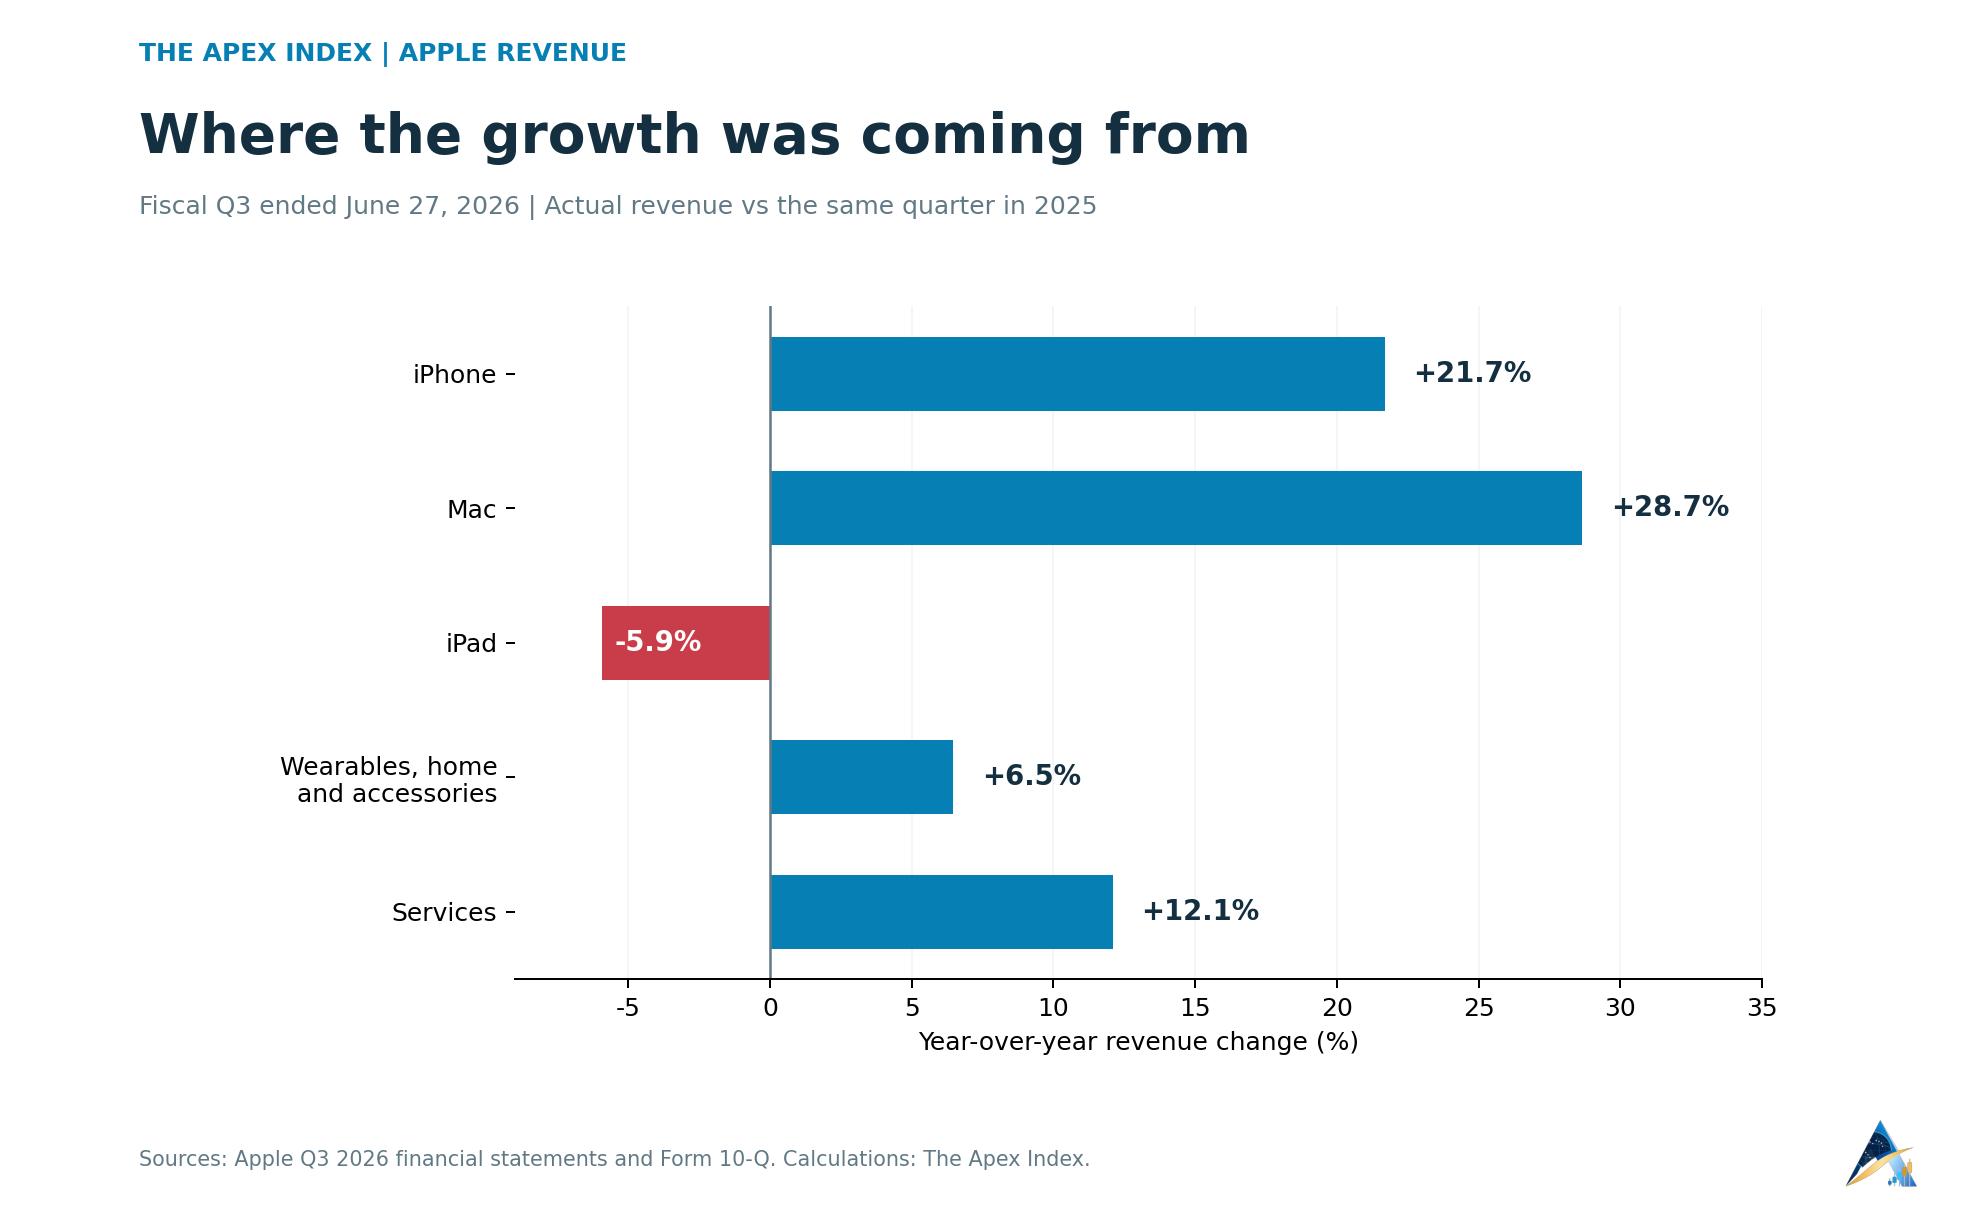
The detailed statements show iPhone sales of $54.25 billion, up 21.7%, and Mac sales of $10.35 billion, up 28.7%. Services brought in $30.74 billion, an increase of 12.1%. The weak spot was iPad, where revenue fell 5.9% to $6.19 billion.
There's an important wrinkle in the profit figures. Tariff refunds added about two percentage points to June-quarter gross margin and $0.11 to diluted earnings per share. Reported gross margin was 50.1%. Investors comparing the next report with that quarter need to account for the refund benefit before deciding whether underlying profitability has improved or deteriorated.
Services deserves attention because its economics are so different from selling devices. June-quarter gross profit was about 75.6% of Services revenue, compared with 40.1% for products, calculated from the reported sales and costs. Changes in the revenue mix can therefore move overall profitability even when total sales look healthy.
Finance chief Kevan Parekh also said in July:
"Our installed base of active devices also reached a new all-time high across all major product categories and geographic segments."
That gives the business an existing audience for subscriptions and upgrades. The coming report will show how effectively that audience translated into another quarter of revenue.
AAPL has held up better than the tech trade
Apple has been showing relative strength. From the October 1 close through October 22, its shares gained 5.42%. Over that identical window, the Nasdaq-100 tracker QQQ fell 5.06%, while the S&P 500 tracker SPY was essentially flat. These are price returns for the two exchange-traded funds, excluding dividends.
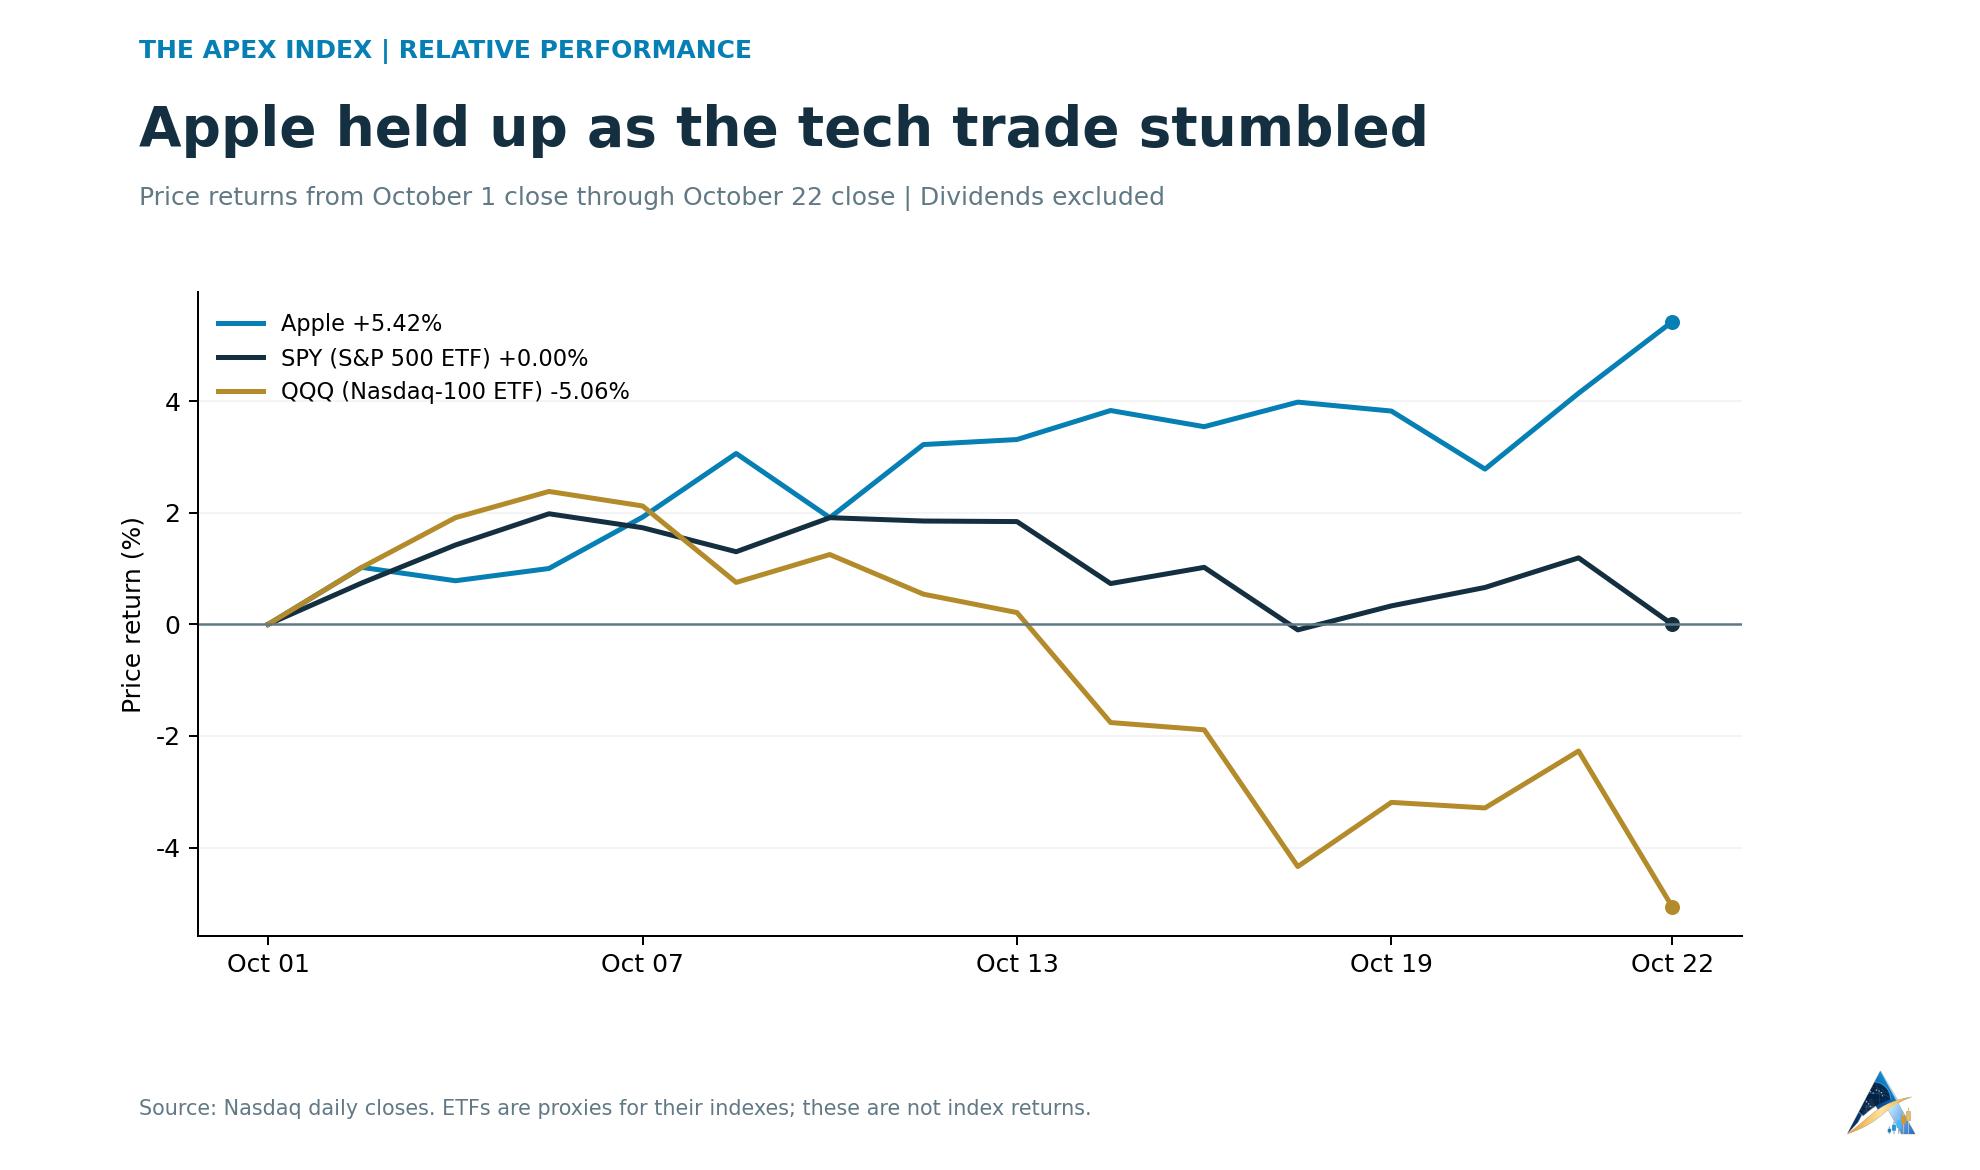
That comparison helps explain the stakes ahead of earnings. Buyers have continued to favor Apple during a difficult stretch for other large technology stocks. A disappointing outlook would test that preference, especially with the shares already trading at a substantial multiple of expected earnings.
Friday's trading offered a small warning about chasing the price. The stock opened at $349.12, climbed above $350, then finished below its opening price. Buyers reached higher during the session but couldn't keep the shares there by the close.
Apple stock technical analysis: the levels to watch
The broader trend still favors buyers. Including Friday's completed session, the 20-day simple moving average stands at $338.91, the 50-day at $329.47 and the 200-day at $294.41. The close remains above all three, with the shorter averages above the longer ones.
The 14-day Wilder RSI is 63.9. That's positive momentum, below the conventional overbought threshold of 70. Regular-session volume was about 39.45 million shares, roughly 1.04 times the preceding 20-session average. The turnover was close to normal, rather than an unusually heavy rush into the stock.
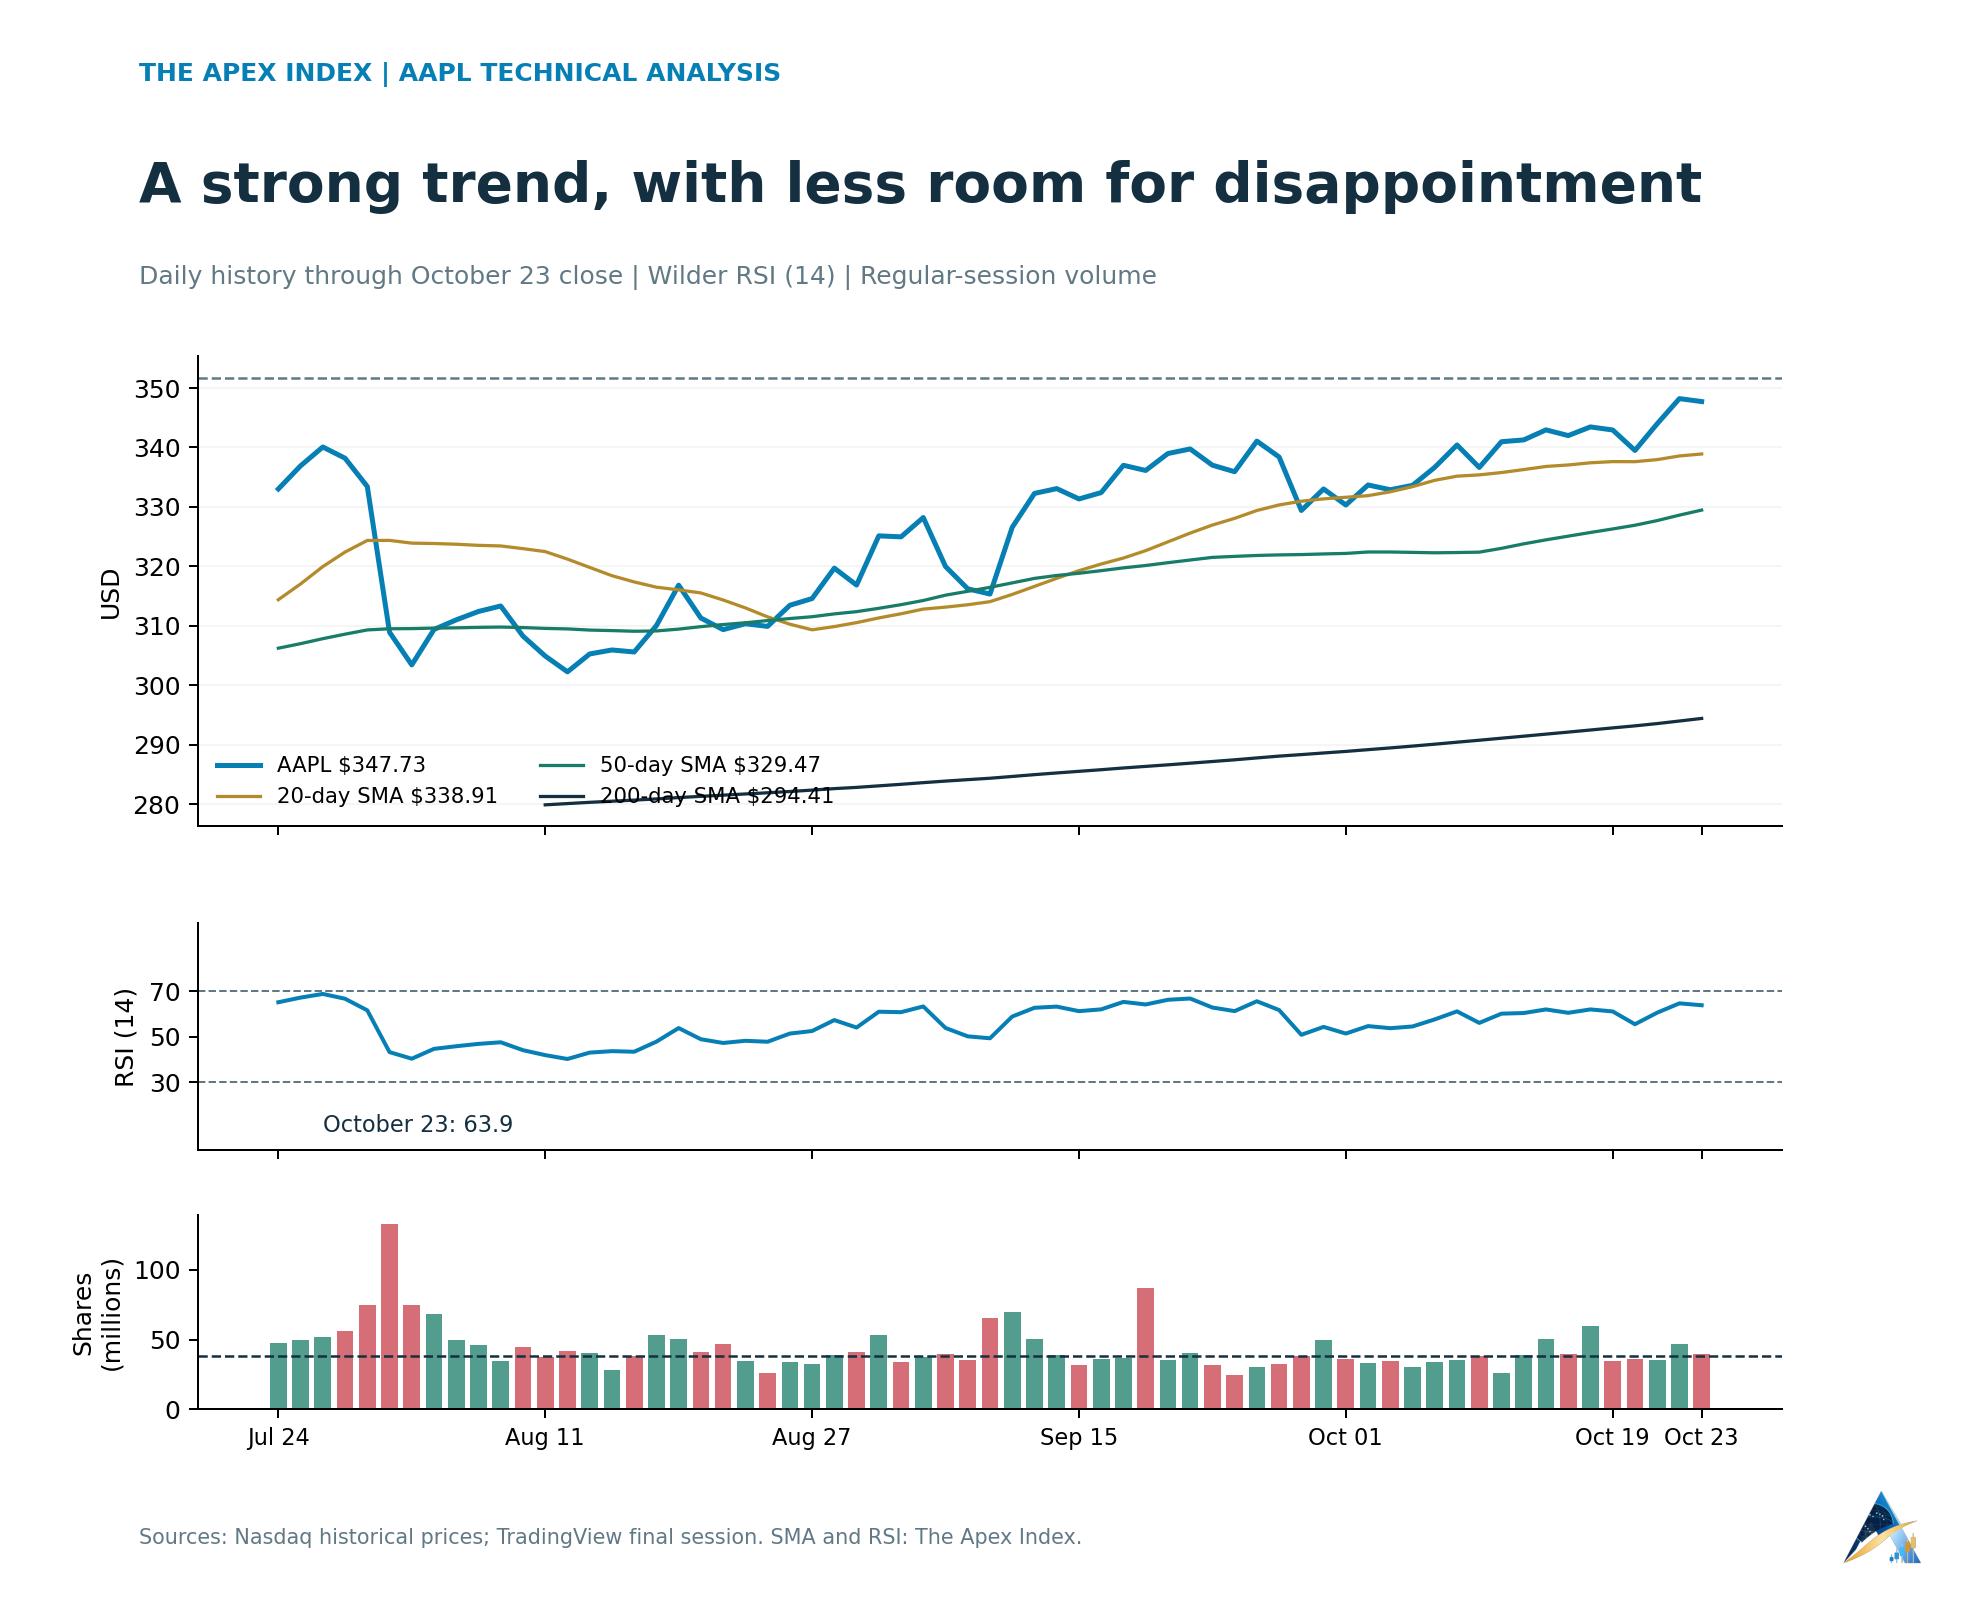
The first upside test is $350-$351.73, covering the round number and Friday's high. A daily close above that area, followed by sessions that hold it, would make the breakout more convincing. The next round-number reference is $360, a conditional checkpoint rather than a calculated earnings target.
On the downside, Friday's $345.75 low is the nearest reference, followed by Thursday's $342.28 low. Below those, the $338.70-$338.91 area brings together Tuesday's low and the current 20-day average. A sustained move beneath that cluster would weaken the short-term bullish case and put the 50-day average near $329.47 in focus.
Earnings can produce an opening gap straight through those levels, so a chart line cannot guarantee an exit price. For buyers considering a position before the report, the practical decision is how much overnight risk they can carry. Waiting for the numbers sacrifices the chance to catch the first jump, but lets investors judge the holiday outlook against an actual price reaction.