

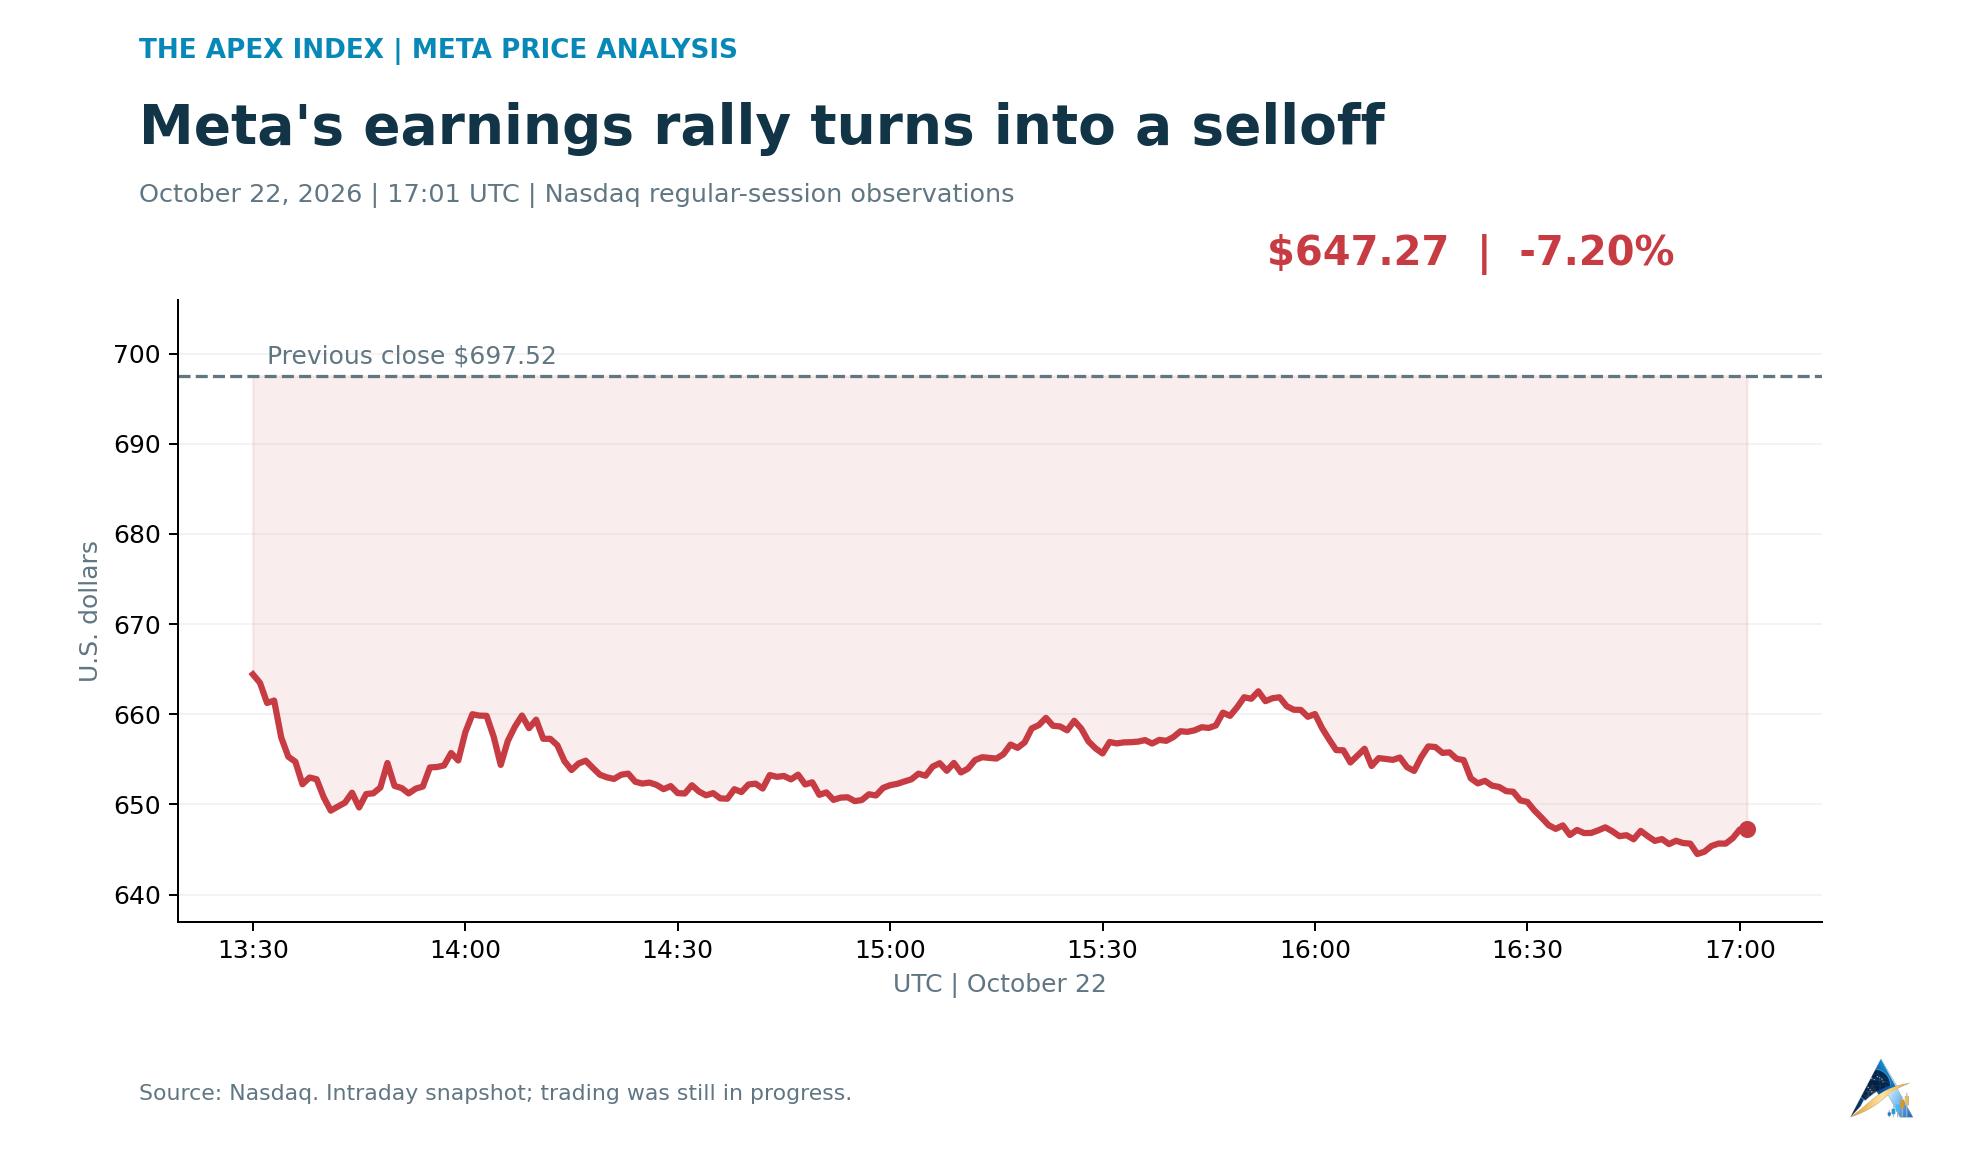
Meta just delivered 26% revenue growth, and shareholders are still selling. The worry is how much money it will take to keep the AI expansion going. Capital spending has overtaken operating cash flow, and a new filing lays out hundreds of billions of dollars of future commitments.
META traded at $647.27 at 17:01 UTC on October 22, down 7.20% from Wednesday's $697.52 close, according to Nasdaq. The selling is broader than one stock: the Nasdaq-100 tracking QQQ fund was down 2.52% at 17:00 UTC. But Meta's drop was considerably steeper.
Why good sales weren't enough
The company’s quarterly release shows a healthy advertising business. Third-quarter revenue reached $64.60 billion, ad impressions rose 10%, and the average price per ad increased 14%. Management expects fourth-quarter revenue of $73-76 billion.
Mark Zuckerberg said:
"Our investments are paying off, the core business is strong, and we're seeing velocity across the board."
The cash figures explain why the market wants more reassurance. Meta generated $32.79 billion of operating cash flow but spent $34.91 billion on capital expenditures, including finance-lease principal payments. That left negative free cash flow of $2.12 billion, compared with positive $10.63 billion a year earlier.
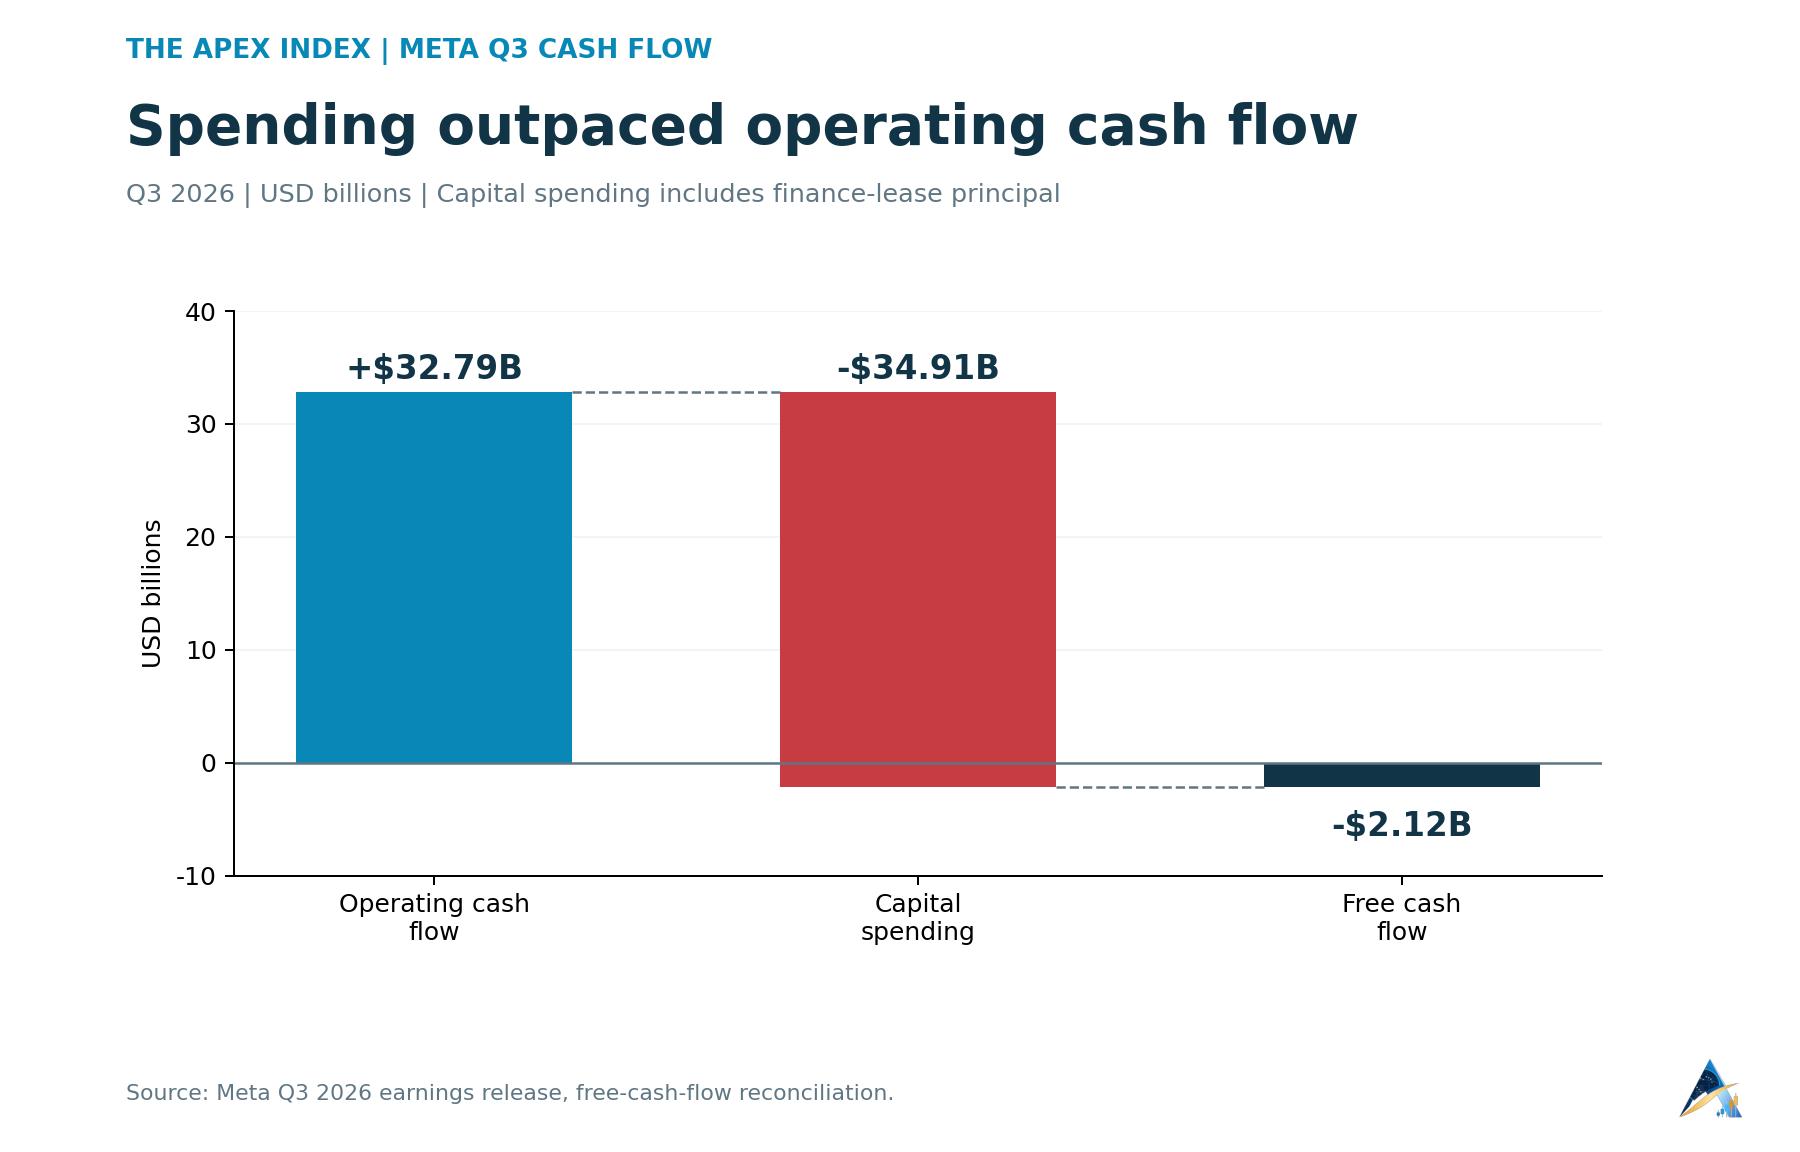
Meta also lifted the lower end of its annual capital-spending forecast by $5 billion. The range is now $135-145 billion, compared with $130-145 billion before. The upper limit stayed the same. For 2027, management says it will keep investing aggressively, with detailed budget plans still being developed.
Reuters reported on Thursday that investors were weighing Muse's growth against the cost of funding it. That concern is visible even with advertising doing well: new AI products need computing capacity before their revenue can cover the expense of serving users.
The new filing puts the commitments in view
Meta's October 22 SEC filing lists $355.73 billion of leases that had not started at September 30 and $454.52 billion of non-cancelable contractual commitments. Together, those categories total $810.25 billion.
A further obligation could require up to $14.72 billion of cloud-capacity purchases, bringing the combined figure to nearly $825 billion. That final amount is contingent and can fall if the provider sells the capacity to other customers.
These are commitments spread across years. Lease commencements extend through 2036, with terms as long as 30 years. The contracts cover cloud capacity, servers, network infrastructure, energy and some Reality Labs hardware. Of the $454.52 billion contract total, $121.41 billion is due in 2027.
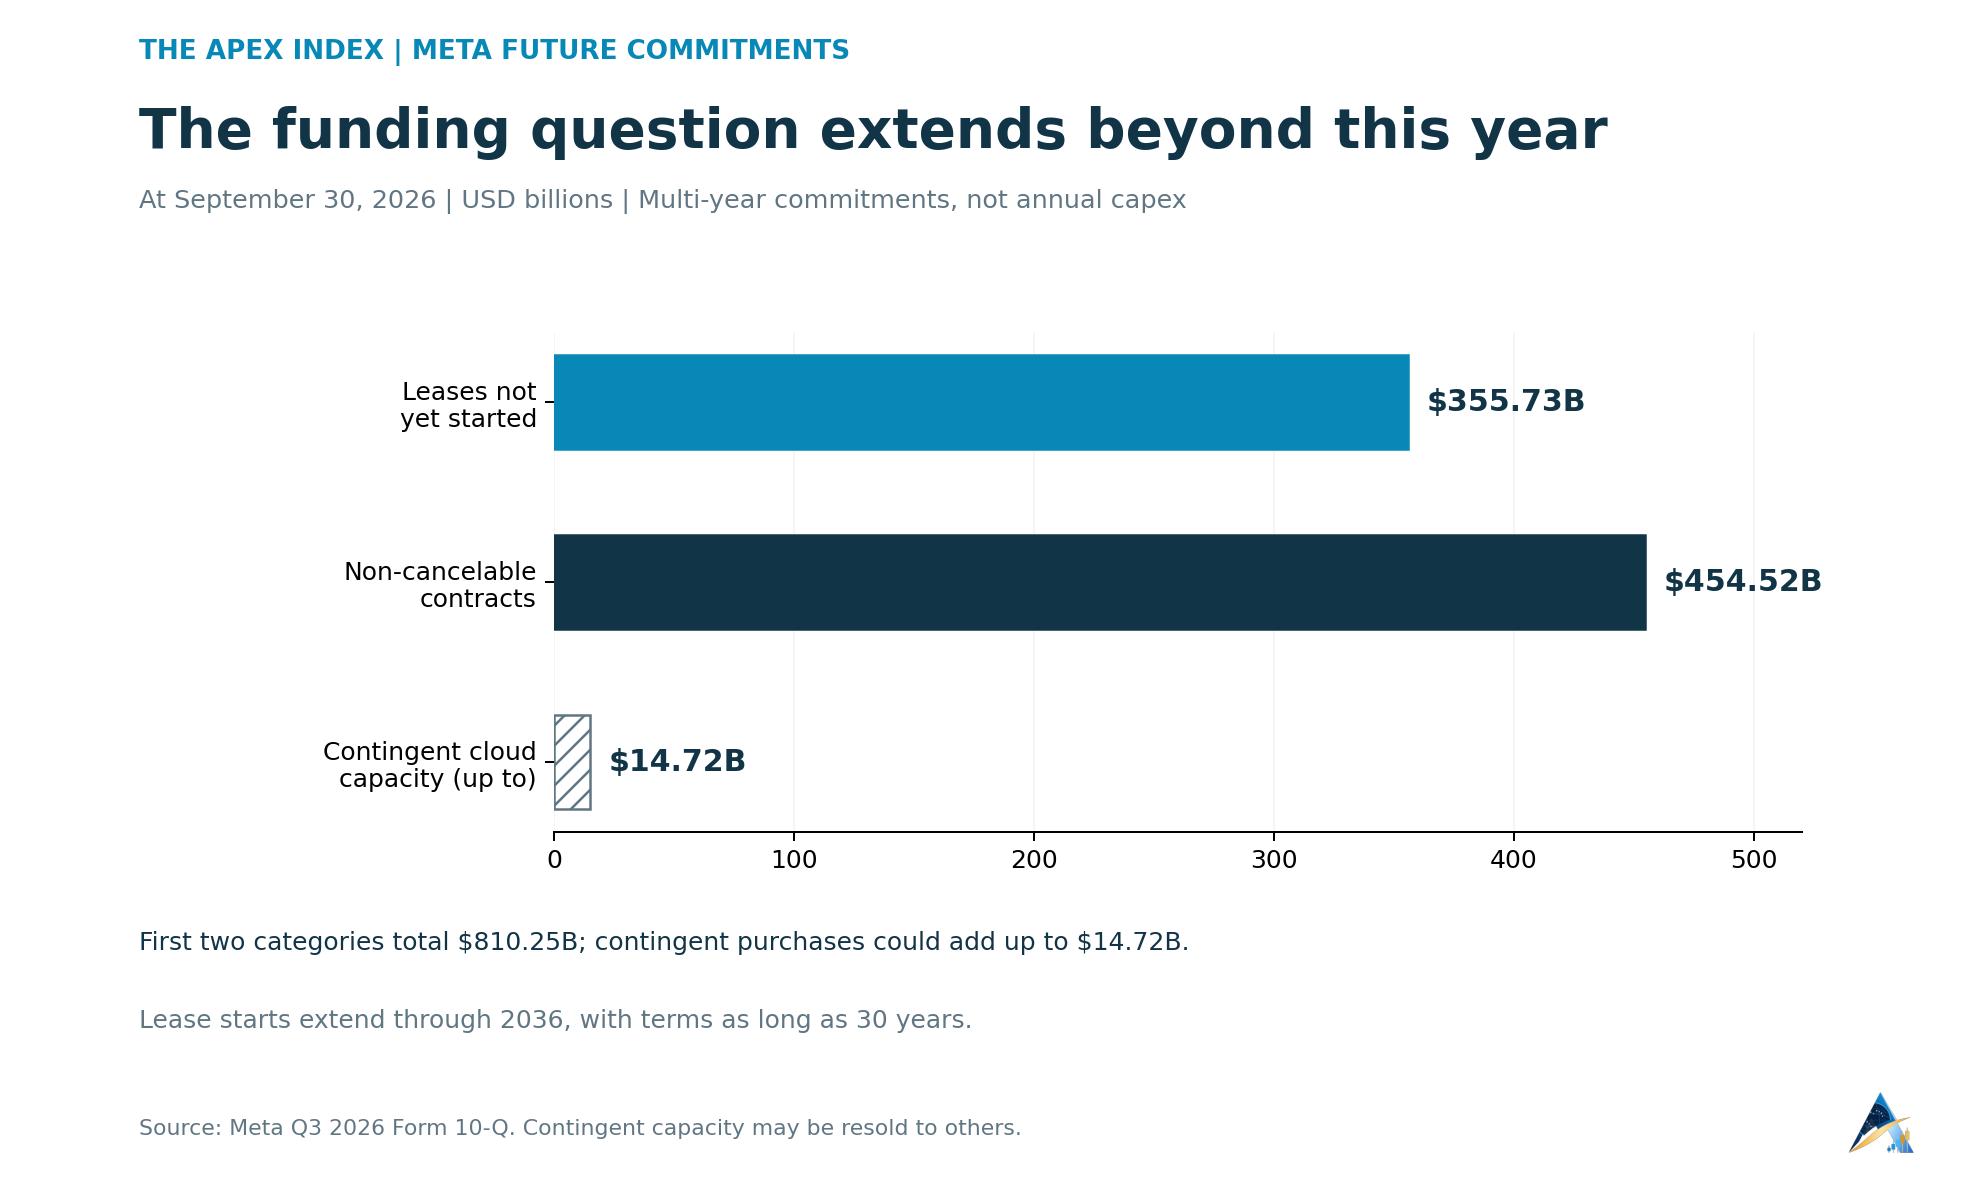
The distinction matters for valuation. Investors are being asked to judge the future revenue those commitments can support while much of the cost schedule is already taking shape. Meta ended September with $82.45 billion in cash, cash equivalents and marketable securities, giving it substantial resources alongside the spending obligations.
New shares and a separate legal bill
Meta plans to establish publicly listed, non-voting Class C shares in January 2027 and distribute one for every existing Class A or Class B share. The structure preserves Zuckerberg's voting control and provides another tool for future financing, acquisitions and employee compensation.
CFO Susan Li told analysts:
"We don’t have any specific financing plans to announce at this time, but we thought it was prudent to establish the appropriate capital structure framework to ensure that we have access to a diverse pool of funding sources."
Creating that class has not raised fresh cash. Any dilution from later issuance will depend on what Meta actually does with it.
There is also the $25 billion New Mexico privacy penalty ordered on October 21, which Meta plans to appeal. It is separate from the $9.89 billion charge in the quarterly results relating to an August agreement with state attorneys general. That existing charge pulled reported operating margin down to 20%; Meta says operating income would have been $22.88 billion without it, against $12.99 billion as reported.
META technical analysis: the levels to watch
The data show a clear break below the 50-day simple moving average at $661.46. That becomes the first recovery test. Above it, Thursday's session high of $681.07 stands ahead of Wednesday's $689.68 low and $697.52 closing price.
Below the market, the immediate reference is Thursday's $644.30 session low. A break there would put the September 9 low of $638.56 in view, followed by the 200-day average at $632.62. These are historical reference points for a possible response from buyers, rather than guaranteed floors.
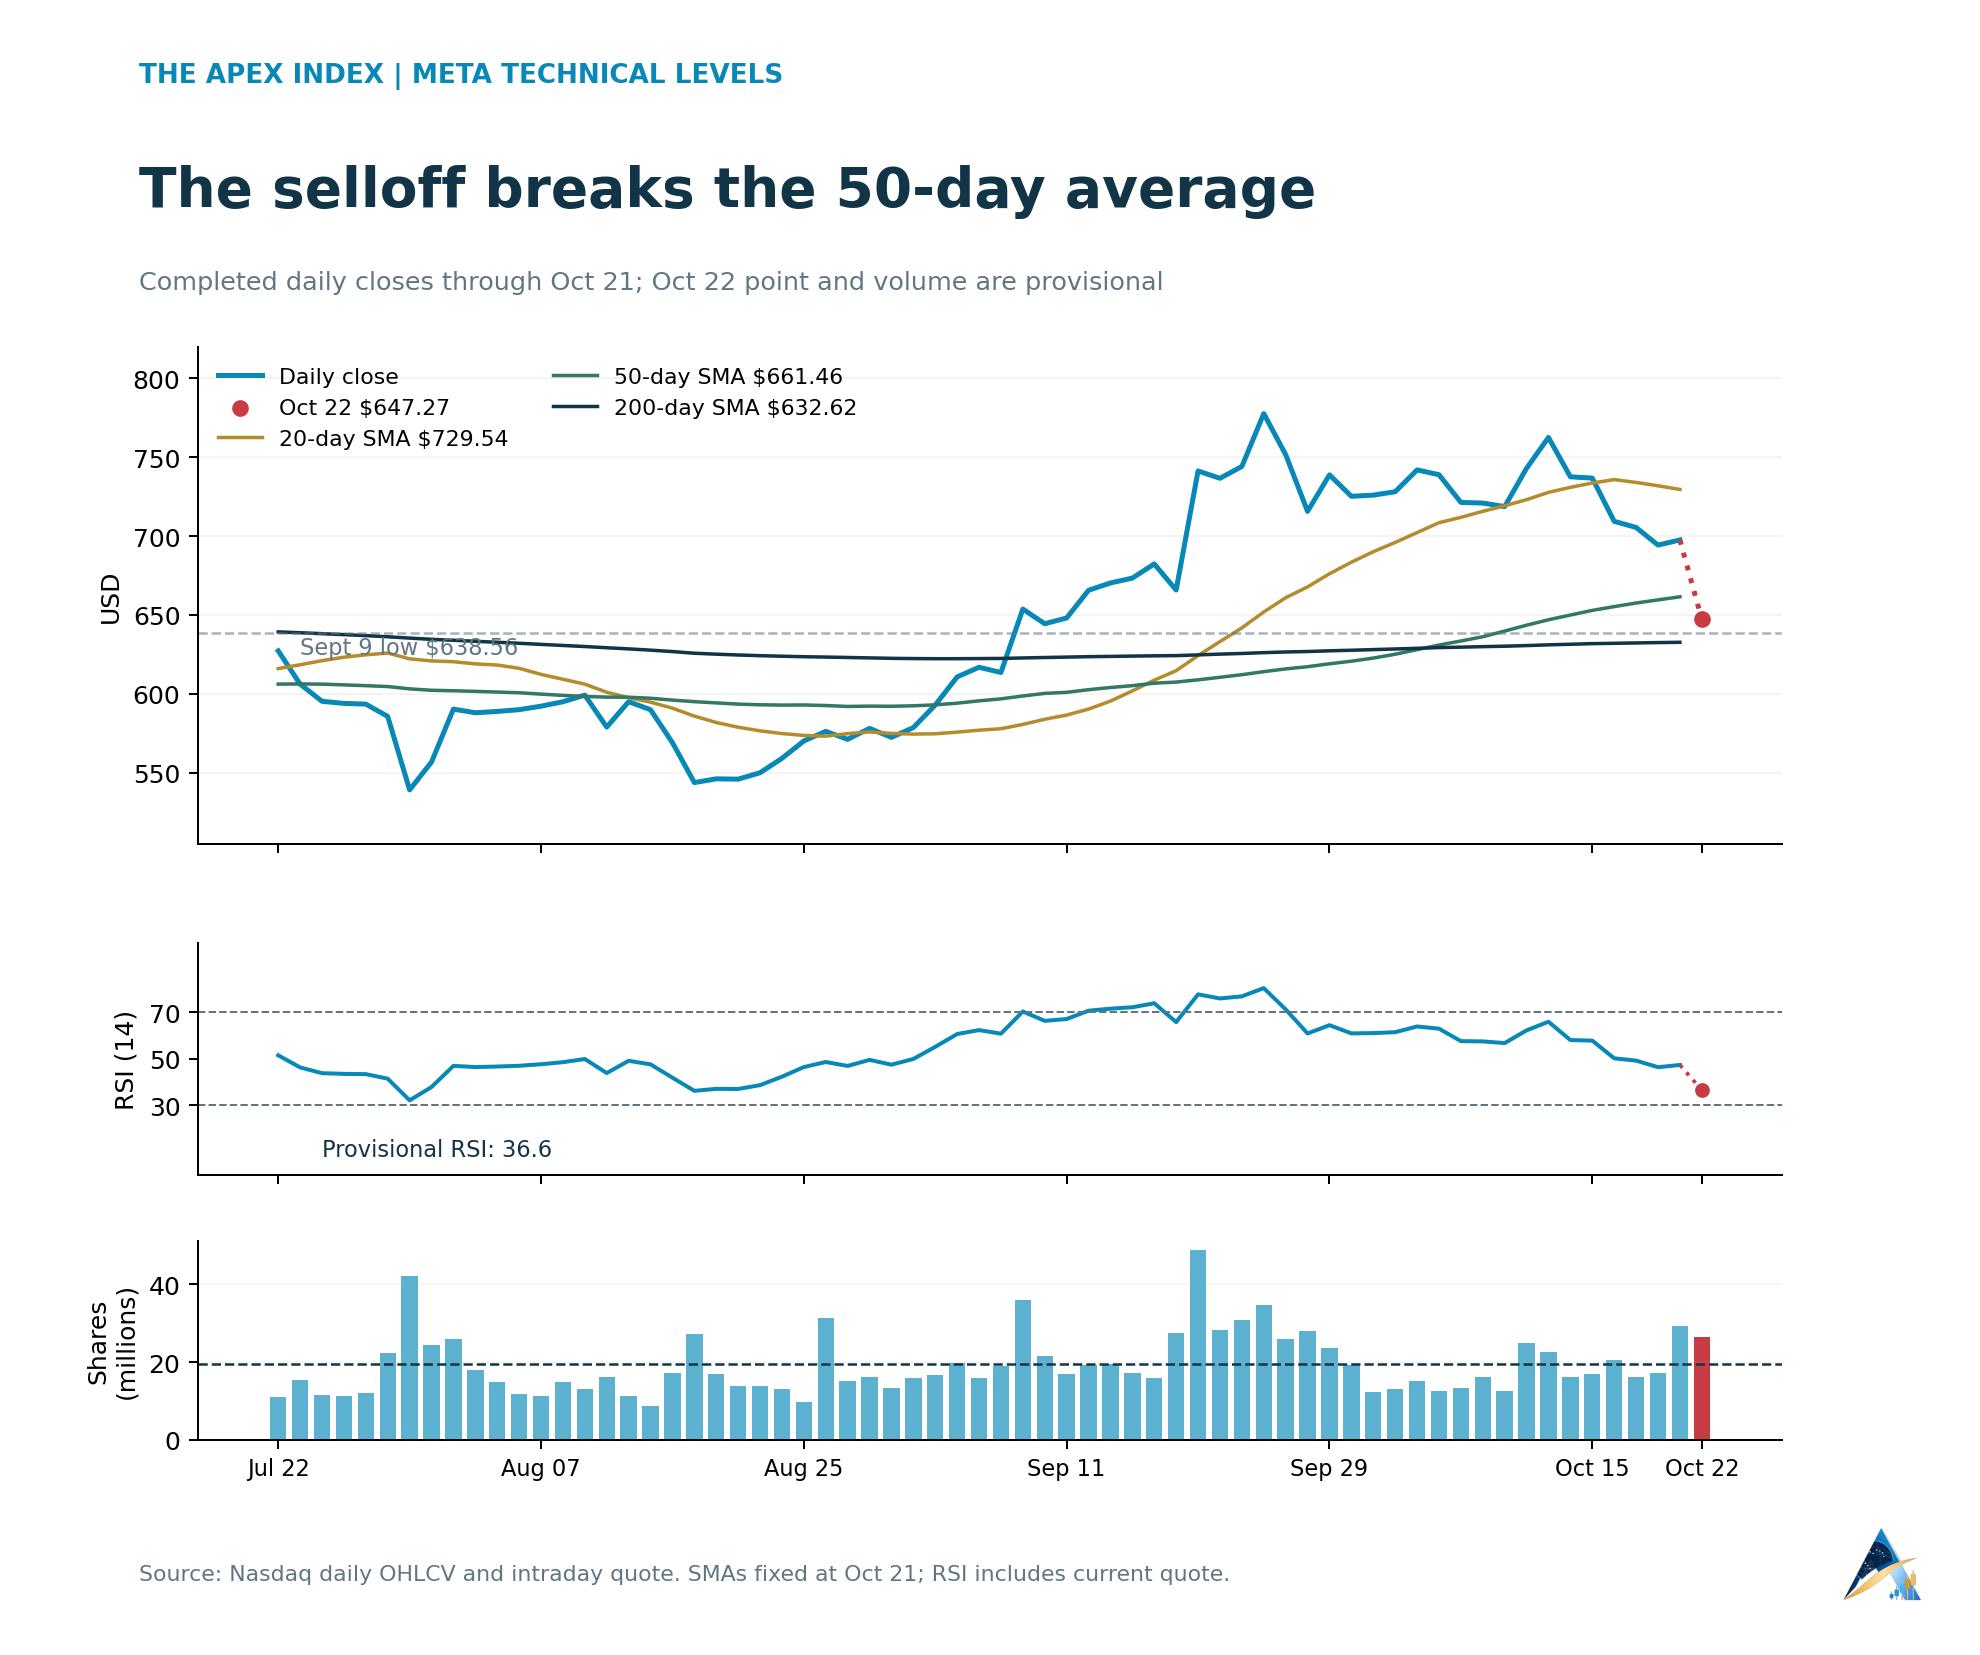
Momentum has weakened too. The 14-day Wilder RSI falls from 47.4 on Wednesday's completed session to a provisional 36.6 when the current quote is included. That is below the neutral midpoint of 50, though still above the conventional oversold threshold of 30. The current session can change that reading before the closing bell.
About 26.54 million shares had traded by the snapshot, already 1.36 times the previous 20 sessions' average of 19.52 million. The decline therefore comes with substantial turnover. The moving averages here use completed sessions through October 21; today's price, volume and RSI are still developing.
For a rebound to repair the chart, buyers would need to recover the 50-day average and sustain that move beyond a brief intraday bounce. A close below the 200-day average would weaken the longer-term setup further, with the early-September trading area near $604.35 becoming another historical reference. Earnings-day volatility can move a stock through these levels quickly.