

A company announces record sales. Its CEO sounds pleased. Then the stock falls. If you've ever watched that happen and wondered whether everyone else was reading a different report, the missing pieces are usually costs, cash, expectations or the outlook.
An earnings report lets you see how a business performed over a period. Reading it well means connecting the numbers, rather than picking the biggest one. You don't need to start with every footnote. You need a sensible order, a few comparisons and an understanding of what each measure can leave out.
This guide follows a fictional company through its results. Every dollar amount in the worked examples is hypothetical, not a real company's performance. The accounting concepts apply broadly; reporting rules, terminology and filing requirements depend on the country and company.
First, make sure you're reading the right documents
Start on the company's investor-relations website. Find the results release, financial statements and any presentation accompanying them. Note the period's end date, currency and units. A table headed "in millions" means a displayed 60 represents 60 million, not 60 dollars. Also check whether figures cover one quarter or the year so far.
The earnings release is management's introduction to the results. It often highlights selected measures and explains the outlook. The statements and notes supply the fuller accounting picture. A slide deck can help explain a business, but it doesn't replace the accounts behind it.
For U.S. domestic public companies, the annual filing is generally a Form 10-K and the quarterly filing a Form 10-Q. The annual financial statements are audited; the quarterly statements are generally unaudited and subject to an auditor's review. An earnings announcement can arrive before the corresponding filing, so return to the filing when it becomes available.
Elsewhere, look for annual or interim reports through the company's home exchange and investor website. The IFRS Foundation's overview explains that IAS 34 sets requirements for interim reports claiming compliance with IFRS Standards, but does not itself decide which companies must publish them. Avoid assuming every listed business follows the U.S. quarterly schedule.
Start with sales, then ask what caused the change
Revenue is the amount recognized from selling goods or providing services during the reporting period. Recognized sales and cash collected can differ. A customer might have received a product but still owe the bill; another might have paid in advance for a service delivered over time.
Suppose our fictional company reports revenue of $1,200 million, compared with $1,000 million in the same quarter a year earlier. That's 20% growth: subtract the earlier amount from the latest amount, divide by the earlier amount, then multiply by 100.
Compare both the year-earlier quarter and the preceding quarter where useful. The annual comparison helps account for seasonal patterns. The sequential comparison shows the latest direction, but a holiday shopping quarter and a quiet spring quarter may be poor direct matches.
Next, open the segment table. Did the established business grow, or did a newly acquired business add sales? Did customers buy more units, pay higher prices or choose more expensive products? For an international company, currency translation can move reported revenue even when local sales barely change.
Management sometimes reports "organic" or "constant-currency" growth to help answer those questions. Read the definition and calculation. Those labels are not a license to ignore reported results, and their meaning can differ between companies. Check whether the helpful extra measure still reconciles with the accounts.
Follow the money down the income statement
Revenue pays for a business's costs before it becomes profit. Cost of revenue usually covers the goods or services sold. Subtracting that from revenue gives gross profit. Operating expenses then include items such as research, administration and selling costs, with presentation varying by business.
Our company previously had $1,000 million in revenue, $600 million in cost of revenue and $250 million in operating expenses. That left $400 million of gross profit and $150 million of operating profit. After $30 million of net interest expense and $20 million of tax expense, net income was $100 million.
In the latest quarter, revenue reaches $1,200 million, but cost of revenue rises to $780 million and operating expenses to $300 million. Operating profit falls to $120 million. Subtract $40 million of net interest expense and $20 million of tax expense, and net income is $60 million.
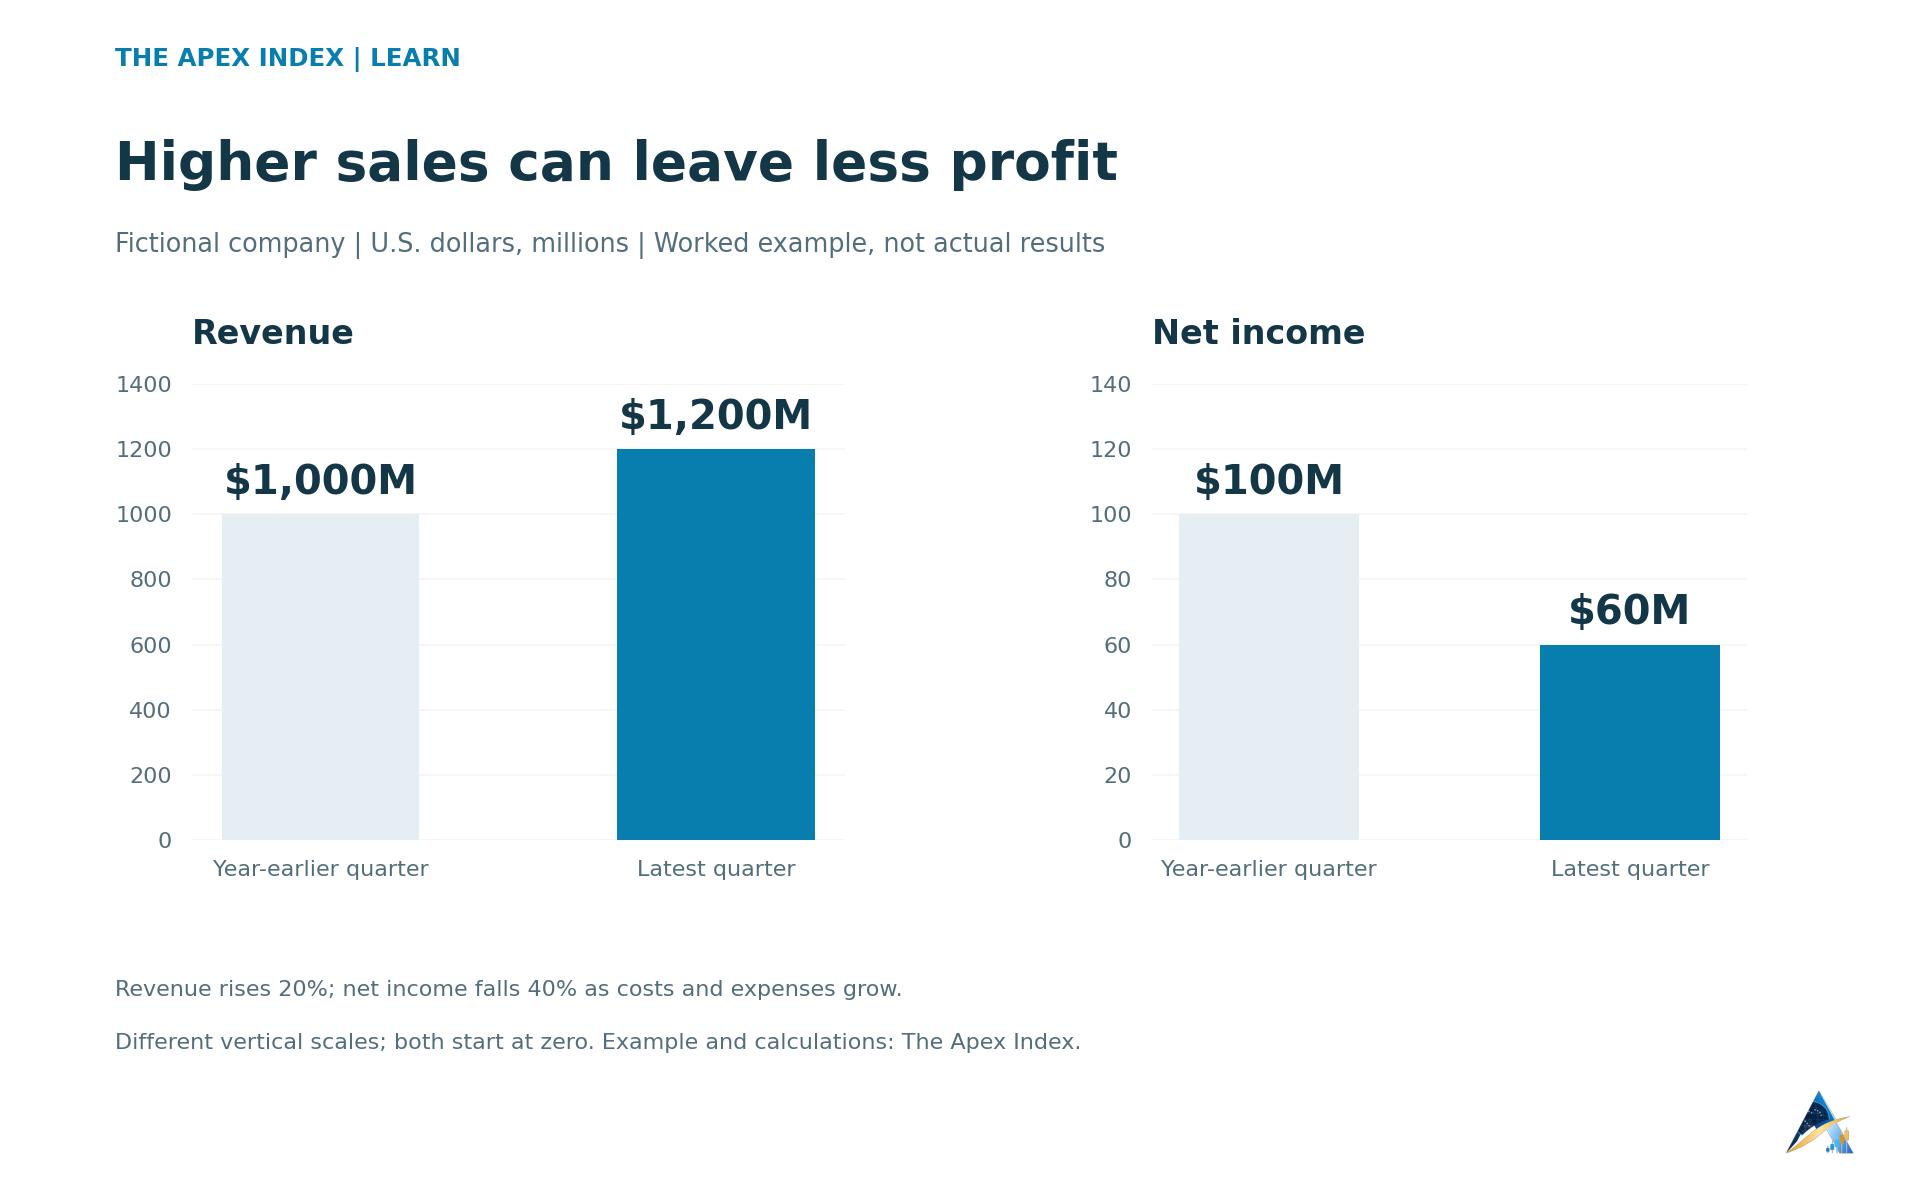
The company sold more but earned less. Its gross margin, gross profit divided by revenue, fell from 40% to 35%. Its operating margin fell from 15% to 10%. Margins help you compare profitability when the size of the business changes.
A lower margin needs an explanation. Discounting, a less profitable product mix, higher input costs or spending on a new business could each contribute. Some pressures can fade; others can persist. Look for evidence in pricing, costs and management's explanation before deciding which situation you're seeing.
Businesses also need different comparisons. A software company, bank and supermarket don't turn revenue into profit in the same way. Gross margin can be useful for a product seller, while a bank's interest income, funding costs and credit losses require a different reading of its accounts. Start with the measures that explain how that particular business makes money.
Compare definitions before comparing competitors. One company may put an expense in cost of revenue while another presents a similar expense elsewhere. Acquisitions and accounting changes can also interrupt a clean comparison. Read the explanation when a margin changes suddenly instead of treating every percentage as directly comparable.
Earnings per share adds another moving part
Earnings per share, or EPS, connects profit available to common shareholders with the number of shares. Basic EPS uses the weighted-average common shares outstanding during the period. Diluted EPS accounts for potentially dilutive instruments under the applicable accounting rules, such as certain options or convertible securities.
For a simple illustration, $100 million of profit available to common shareholders divided by 100 million weighted-average shares gives $1 of EPS. If profit stays unchanged but the share count falls, EPS can rise. If new shares increase the denominator, EPS can weaken without a fall in total profit.
That's why buybacks deserve a separate look. They can change the per-share result, but the income statement still tells you whether the business earned more overall. Read basic and diluted EPS, the share-count movement and the money spent buying shares together.
Read adjusted earnings with the reconciliation open
In U.S. reporting, GAAP means generally accepted accounting principles. Companies also publish non-GAAP or adjusted measures that remove selected items. Under other accounting systems, businesses may use labels such as alternative performance measures. The question remains the same: what did management remove, and why?
An adjustment can make a useful comparison easier, particularly when an unusual event distorts one period. It can also make performance look better by excluding expenses that shareholders still bear. Stock-based compensation, acquisition expenses and restructuring charges deserve attention when they appear repeatedly.
Find the reconciliation between the adjusted measure and its closest accounting equivalent. Check each addition or subtraction, its tax treatment and whether earlier periods were treated consistently. A label like "one-time" becomes less persuasive when a similar cost returns every year.
The SEC's guidance warns that excluding normal, recurring cash operating expenses can produce a misleading non-GAAP performance measure. Adjusted profit also should not be treated as money available to spend. That requires the cash-flow statement.
Check whether profit turns into cash
The income statement records business performance using accounting rules that don't simply track payment dates. Depreciation spreads the cost of an asset across its estimated useful life. Credit sales can count as revenue before customers pay. These are reasons profit and cash move differently.
The cash-flow statement separates operating, investing and financing activities. Operating cash flow concerns the business's operations. Investing activities include purchases of equipment and certain investments. Financing activities include transactions such as borrowing and issuing shares.
Return to our latest-quarter net income of $60 million. Assume $40 million of depreciation is added back because that expense didn't use cash in this period. Then assume working-capital changes absorb $30 million, with no other adjustments. Operating cash flow is $70 million.
If the company spends $100 million on equipment, a common free-cash-flow calculation gives negative $30 million: operating cash flow minus capital spending. The business reports a profit while using more cash on those investments than its operations generated.
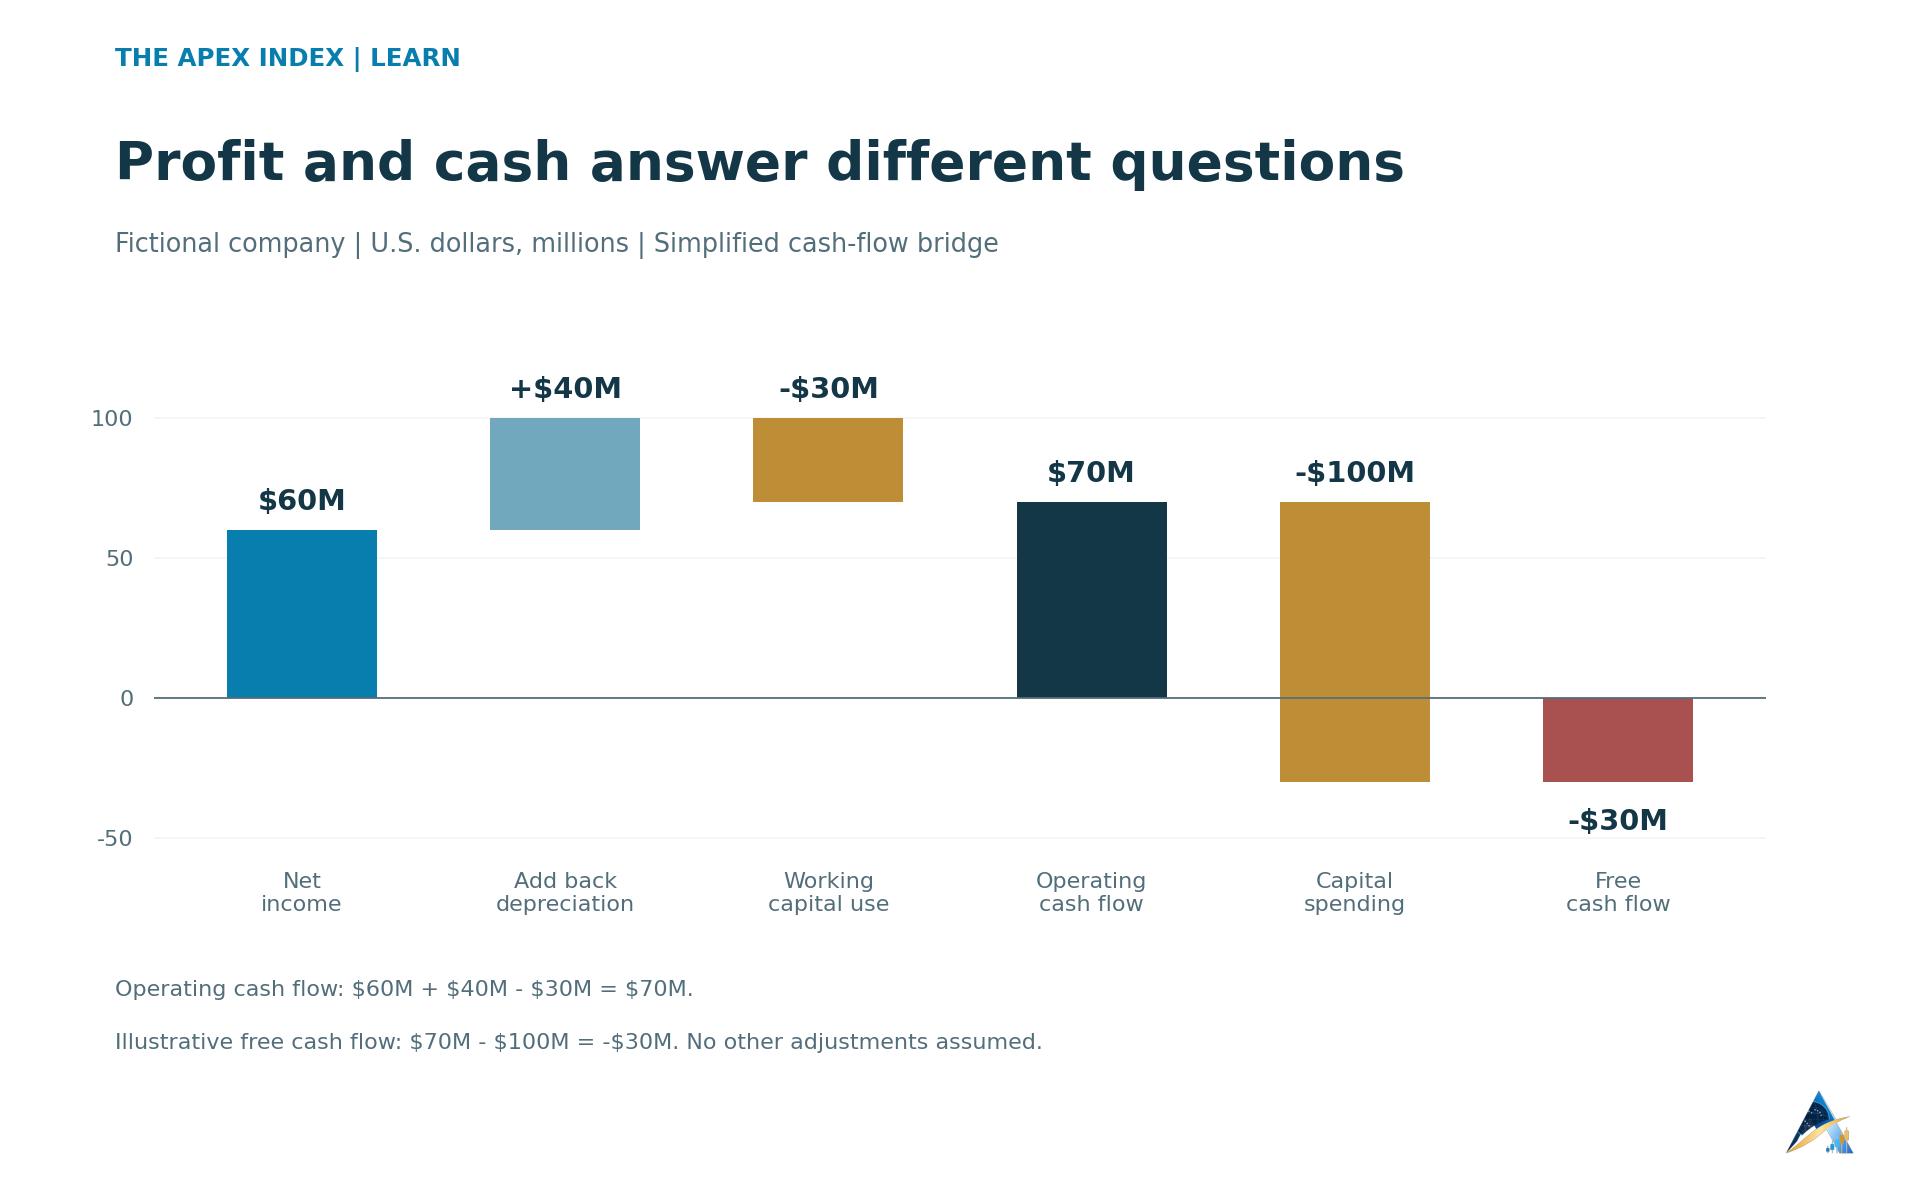
That can happen during an expansion, but the company needs a way to fund it. Check cash reserves, financing and whether management explains how the new assets should earn a return. Negative free cash flow alone doesn't tell you whether an investment is sensible.
Free cash flow has no single uniform definition. Companies can treat leases and other payments differently, so use the stated calculation rather than comparing identical-looking labels blindly. It also doesn't automatically represent cash left after every mandatory payment, including debt repayments.
Working capital helps explain short-term changes. Rising unpaid customer bills can absorb cash; paying suppliers later can temporarily preserve it. A single quarter may reflect timing. Several periods can reveal a pattern, especially when sales growth repeatedly arrives without similar cash collection.
Open the balance sheet before trusting the cash pile
The balance sheet shows assets, liabilities and shareholders' equity at a specific date. A large cash balance sounds reassuring until you compare it with borrowings, upcoming payments and restrictions on using that cash. Some businesses need substantial cash simply to operate.
Read current liabilities alongside current assets, then inspect the debt notes for maturities and financing terms. Debt due soon creates a different problem from debt due years later. Refinancing can become more expensive even if the company has not borrowed more.
Look beyond the headline debt figure when commitments matter to the business. Leases, promised equipment purchases and other contractual obligations can affect future cash needs. They don't all belong in the same accounting category, so avoid adding them into one unexplained "debt" number.
Inventory also deserves context. A retailer building stock before its busiest season may be behaving normally. Inventory rising faster than sales for several periods may require a closer look at demand and discounting. The balance sheet gives you questions to investigate, rather than a verdict by itself.
Put the outlook beside the expectations
Guidance is management's forecast, usually for measures such as revenue, profit or capital spending. It can be a range, and it depends on assumptions. Save the earlier guidance before reading the update so you can tell whether the business has raised, lowered or maintained its outlook.
Analyst consensus is a collection of forecasts, not a promise. Different providers can include different analysts and update their figures at different times. Check that the estimate and reported number cover the same period, currency and accounting basis before calling the result a beat or miss.
For example, hypothetical adjusted EPS of $1.10 beats an adjusted estimate of $1. It does not establish a beat against a GAAP estimate of $1 without checking the corresponding GAAP result. Mixing those measures can turn an impressive headline into a bad comparison.
The outlook also explains why a stock can fall after strong results. Investors may have expected faster growth, a better margin or a more optimistic next quarter. A company's share price reflects expectations about future cash and risk, rather than awarding points only for last quarter's revenue.
Use the call to test the explanation
Read management's prepared remarks, then the questions and answers. An analyst may ask why a margin fell or when a costly project will start producing revenue. Compare the answer with the actual numbers and earlier promises. A detailed explanation can be useful without making it a guarantee.
Pay attention when a company changes a metric, stops disclosing it or changes how it calculates it. There may be a reasonable business explanation. You still need a consistent basis before declaring an improvement. Footnotes and accounting-policy explanations often supply the missing detail.
Your aim is a short, defensible account of what changed: the source of sales growth, the movement in profitability, cash generated, financial obligations and the outlook. Record unanswered questions alongside the numbers instead of filling the gaps with confidence.
The SEC's financial-statement guide puts the central limitation plainly:
"No one financial statement tells the complete story."
Before acting on the report, return to the paragraph or table supporting the claim you care about. If the decision depends on a temporary tax benefit, a major customer renewing or an expensive expansion paying off, that specific assumption needs more attention than the headline beat. Facts and accounting references in this guide were checked on October 27, 2026, UTC.